Reviving 1D Model
In this post I will show that the analytical 1D model of diffusion is similar to our 3D COMSOL model, with the exception that the times do not seem to line up. This is reasonable though since the 1D model does not take into account the non-membrane silicon pieces and enlarged volumes that occur in the 3D experiments.
All simulations assume two 1mm long wells separated by a membrane (since this is 1D the wells do not contain any volume). I can determine the resistance of the membrane in a manner similar to the 3D system. This briefly involves adding the permeability due to Renkin and pore discovery terms as conductances in series. I then average the concentration in the wells at the end of the experiment and divide filtrate concentration by retentate.

These same features are observed in the 3D model. The thin membrane poses little reduction to diffusion until the molecules come very close to the pore size and then the diffusion through the membrane drops dramatically. The thick membrane case experiences more reduction to its diffusion long before the pore cutoff is ever reached.
Next we plot the normalized effective diffusion coefficients for these separations. As a reminder, the effective diffusion is a quantity that reflects the impact the membrane presents to the total system; it is not the membrane diffusion coefficient. Here we see a similar trend to 3D models:
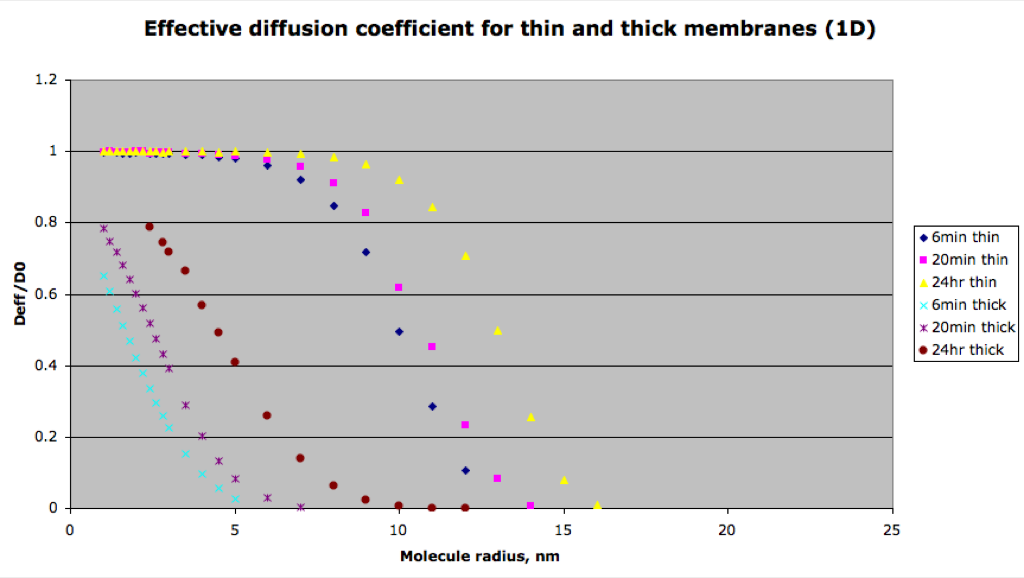
Shorter times means the membrane has a larger impact on the separation as the drop to the cutoff occurs at smaller molecular radii. A thick membrane analyzed in this way shows a steeper drop at much smaller radii. This may be because the thick membrane acts more like a size exclusion column due to its thickness and can have a better resolution. However this chart does not show that the pnc-Si membranes are approaching equilibrium more quickly as the previous chart does.
Finally I tried a few made up membranes to test the effects of pore size and porosity. Mem1: 5%, 10nm radius cutoff, Mem2: 1% 10nm cutoff, Mem3: 5% 5nm cutoff, Mem4: 1% 5nm cutoff.
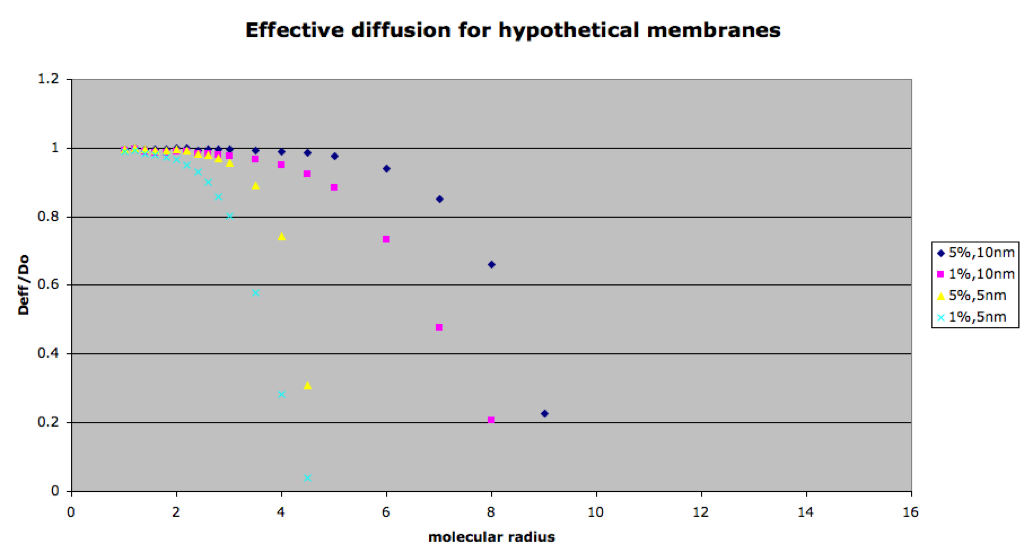
This also looks very similar to the 3D results. Again, lowering the porosity increases the effect the membrane has on the separation under the cutoff while the smallest molecules experience little resistance. Reducing the cutoff changes the size at which the Deff begins to drop.
I feel that these results validate the 1D model as a predictive tool and as a complete analytical description of diffusion. The benefit of the 3D model is that we can directly compare to a 3D experiment using the same tools as the 1D model.
Update:
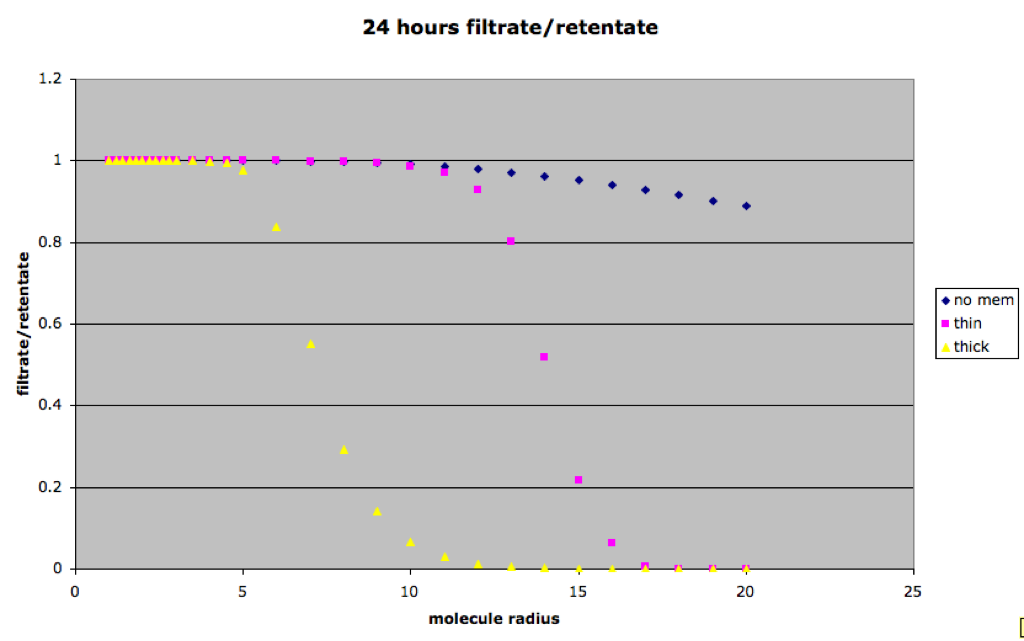
Here is a 24 hour comparison of filtrate/retentate ratios for thick and thin membranes. You can see that the thin membranes have a molecular weight cutoff closer to the physical cutoff in this image. Also the cutoff seems sharper based on the width of the sigmoid.
Can you show the filtrate/retentate graph for 2 or 3 more time points on the way to near-equilibrium? It doesn’t seem like 20 min is very useful for low-loss separations. Over time, I suspect the thick and thin membrane curves will evolve quite differently.
The reason I used 20 min was because it was a reasonable comparison to the last figure in this post. I’ve added the 24 hour comparison.
I have 2 questions related to short times. 1) Can you comment on whether at 6 minutes IgG should be hindered relative to BSA by our membranes as is claimed in the Nature paper? Remember we claimed that the hindrance is greater than the difference in free diffusion would predict. 2) Can you confirm my impression that the 1-D model highlights the impact of time on hindered diffusion better than the 3-D model does? Plotting your second figure for 1-D and 3-D at the same time and volume (thin membranes only) would show this.
1) I did the 6min timepoint to be able to make that comparison. I even processed the old membrane used in the nature paper, however I did not get the same results. I will be posting that soon.
2)1-D and 3-D models do not line up at time points at all. It seems the 20min 1D is closer to the 24 hour 3D (this was the problem all along with comparing to experimental). Also there is no volume in the 1D situation, yet I do use a well length on par with the 3D. I’ll try to make some sort of comparison plot though and upload it soon.