Negative Assay Follow Up
In yesterday’s post I showed that I was able to obtain good negative adsorption assay results, but there was one major problem. The cellulose and PES actually had higher protein concentrations after the assay. I suggested this was because they are drawing in water to some extent, but protein was not able to pass through because of the cutoff.
With a good suggestion from Jim, I tried to tackle this problem today by pre-wetting the polymer membranes. Both PES and cellulose were pre-wet for 20 seconds by swishing in PBS. I then measured the protein concentration at 0 minutes on the pre-wet membranes to get an idea for the starting concentration in case of dilution because of the pre-wetting step. Then I measured the concentration after 20min.
The following graph will show these results:
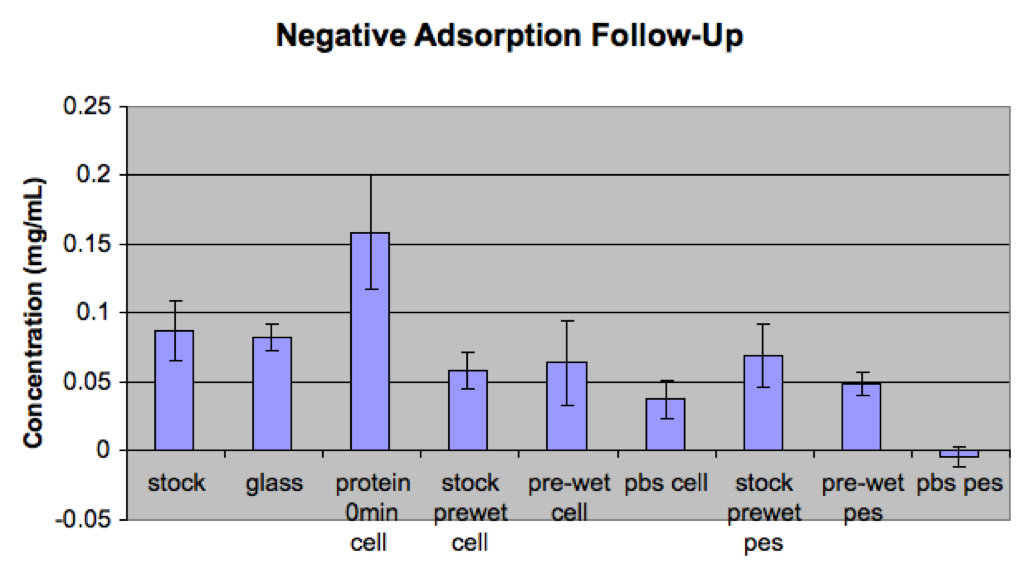
- Stock protein solution concentration.
- Adsorption on glass after 20min (for comparison).
- Protein directly on cellulose at 0 min. No pre-wetting. This is to see if that high concentration effect is immediate or not. Seems that it is. Maybe there’s something being given off by the cellulose that adds to the concentration???
- Concentration of the stock on pre-wet cellulose after 0 min.
- Concentration after 20min. Seems that this is very close to the stock. High error may be accounted by uneven dilutions due to pre-wetting. Not that concentration is below master stock (#1).
- PBS on cellulose after 0min. The answer to question in #3. Apparently there’s a little bit of something we’re measuring right on the cellulose.
- Concentration of protein on PES after 0min.
- Concentration after 20min. Less than both stocks.
- PBS on PES after 0min. There’s really nothing to measure here.
UPDATE:
If you take a look at these graphs, there’s a lot of overlap in the error bars. In order to find the amount of adsorbed protein I have to subtract the mean of the sample from the mean of the stock. This gives me a very small number, and when I figure out the total amount of propagated error, it’s almost a magnitude higher than the calculated value. Obviously this is not suficient. I’m not sure how to solve the problem yet, but if the method works I may just need to change concentrations and other variables to get a bigger difference.
If you combine the glass data for the two runs and normalize each material to the appropriate stock, I think this just might tell the same story as the positive assay.