Hindrance is magnified in thicker membrane
Using the same procedure as in the last post, I was able to simulate a 6um thick membrane with the same pore characteristics as the experimental pnc-Si membranes. Material diffuses more slowly through this membrane, but not as slowly as I expected. The following figure shoes the filtrate/retentate concentration ratios at 24 hours for a thick and thin membrane with the same pore characteristics.
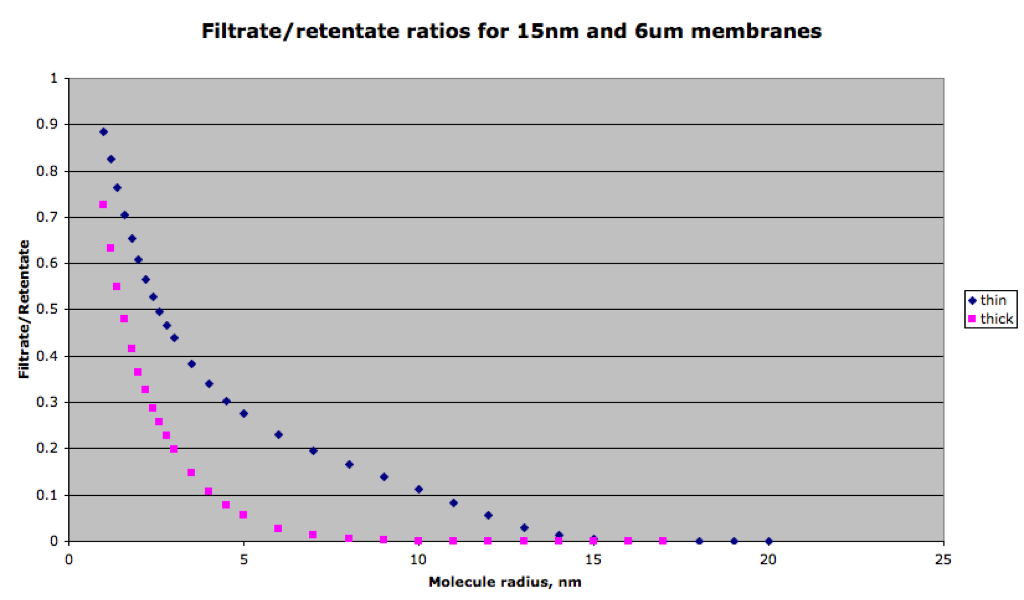
The thick membrane has slower diffusion, but this doesn’t seem like an unreasonable slowdown. In fact this agrees with early cellulose separations that showed similar characteristics to pnc-Si separations. However this slowdown is more abrupt for the larger species.
This means that there is increased hindrance within the thick membrane which slows molecules compared to their original free diffusion coefficients. If we use the comparison metric of effective diffusion coefficient, we see that this hindrance is more dramatic than for pnc-Si membrane in the following figure.
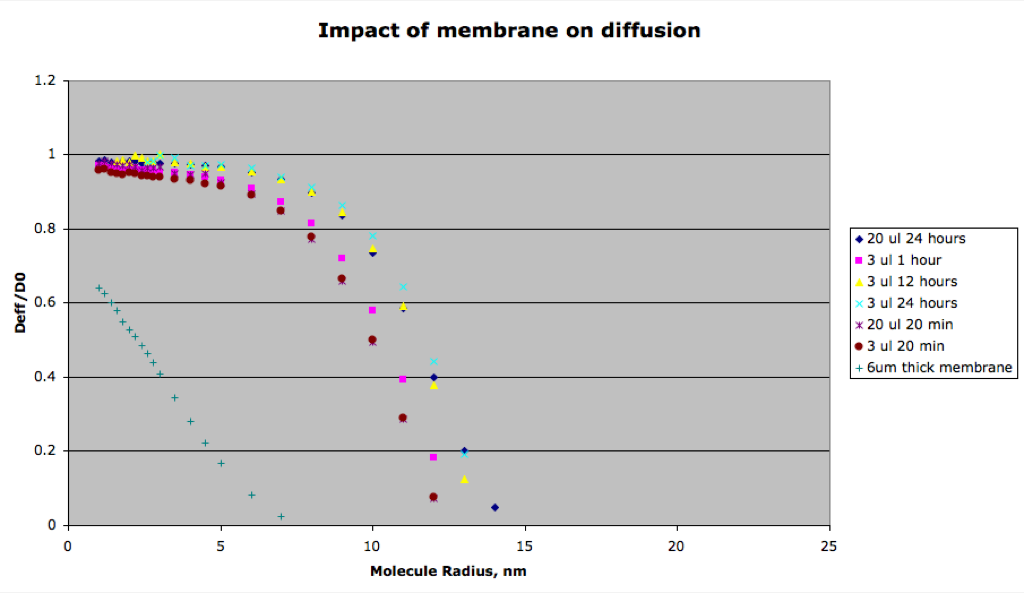
This means that the increased hindrance actually improves the quality of separations for these membrane, which may be contrary to our previous statements. However the rate at which these separations take place over is slightly slower than that of pnc-Si membranes. Also the separation cutoff is lower than the physical cutoff for these separations, a fact that doesn’t seem to be exhibited by the pnc-Si membranes as much.
Perhaps having a thicker membrane is like having a longer column in size exclusion column chromatography; the length of the column improves the resolution.
Chris writes in his comment that only a small change in the filtration characteristics leads to a big change on the Deff plot, and maybe the changes we have seen for our membranes on the Deff plot aren’t really all that significant. Maybe the following figure can help to explain the difference:
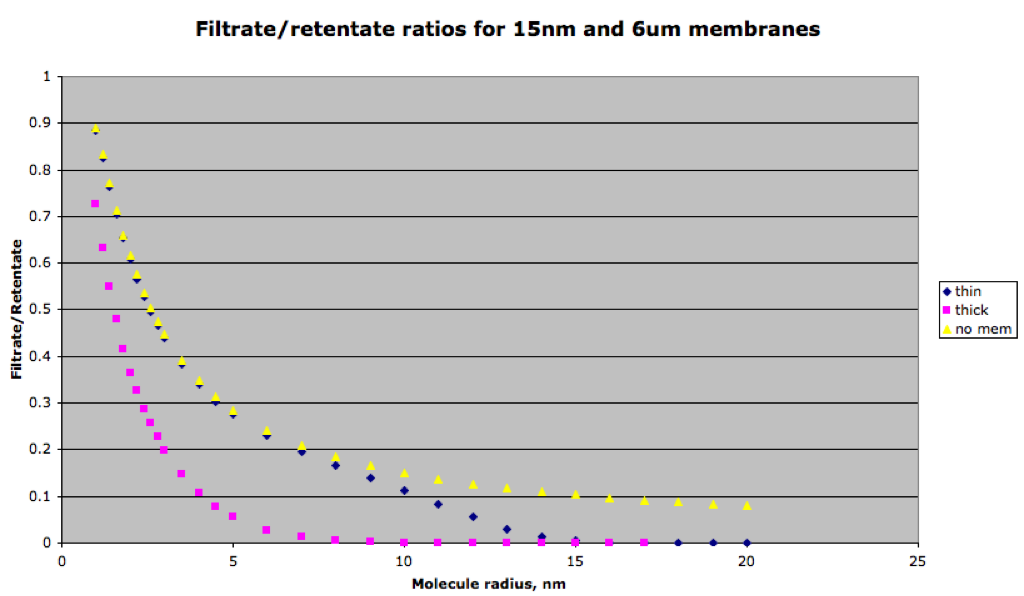
The filtrate/retentate ratios of the pnc-Si membrane are very similar to the case of no membrane until a molecule size of 10 nm. This is because the cutoff of this membrane is around 15 nm (30 nm diameter pores) and as the molecule gets close it is hindered more. The thick membrane is never quite as fast as the no membrane case, and it drops off rather significantly by 5 nm. I think this means that our membrane provides almost no resistance to diffusion until you start to reach the pore cutoff, however thick membranes are always experiencing resistance.
Edit: Semi log plot of above figure.
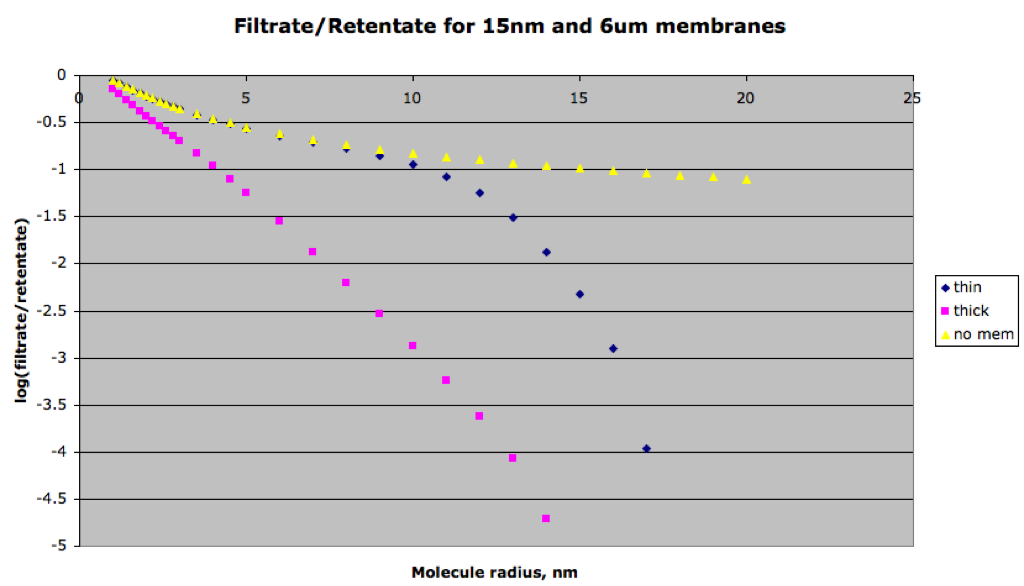
Thin mem drops quicker to cutoff (approx 17/18 nm).
How are the membranes modeled in your simulation? As the thickness increases, it would seem like the details of the model would become more important.
Also, I assume that both membranes have 30nm pores, correct?
I think this post also shows how difficult it is to interpret the Deff plot. It appears that you need a massive difference in this plot to create a small change in the actual filtrate/retentate separation. Can you add a “no membrane” line to the filtrate/retentate graph, to show the full picture? Thanks!
The membrane in this model was 6 um rather than the 15 nm in the previous model. The fluid and geometry of the retentate and filtrate wells remain unchanged (both still have 20 ul).
The membranes have the same pore characteristics, a distribution around 30 nm.
In the Deff plot, no membrane would be a straight line at 1 because the entire plot is normalized to the no membrane diffusion coefficient.
There is nothing surprising here. More time to interact with the pore walls means more hindrance. Pnc-Si is an excellent tool for creating compartments without significantly hindering almost all the molecules smaller than the pores. Thicker membranes hinder even molecules much smaller than the pores. Its a nice result if we spin it in a positive way. Hopefully the impact we see on Deff at short times can explain the fact that we claimed a hindrance based on the size of molecules in the original Nature paper. Those were very short time experiments – 6 minutes.
I guess what I was asking for regarding the model was whether you are actually creating a mesh that goes into the very long pores of the thick membrane, or whether you are doing a side calculation that is yielding a diffusion coeff that then gets plugged into the FE simulation? For the pnc-Si, I’m not so worried about the details of the model, since you just do the best you can for this fairly simple aperture structure. With a long narrow pore, it seems far more complicated to examine all the effects that can happen along the path down a tube. Do we have any experimental data that we can use to benchmark? I remember the Tom did an experiment with Alexa dye in a glass tube, with a dialysis membrane stretched over the end, and this proved to be substantially slower than an experiment with pnc-Si. It was much more than the 10’s of percent differential shown in the filtrate/retentate plot, however, I do not remember the details of the membrane that Tom used.
I like the new filtrate/retentate plot – it shows the dynamics quite clearly. Could you also plot a log-scale version, as I’m curious what the dynamics of the thick membrane look like in the 7-15nm range. I assume it does not really hit zero until 15nm. Thanks.
The mesh does not go into any pores. The membrane is treated like a continuum slice that has specific properties. I define a diffusion coefficient for the membrane slice in a separate MATLAB program that I have written. The diffusion coefficient is found by combining two specific resistances, Renkin and pore discovery (aka Shigeru), using an electrical analogue (I did this on the board a few months ago).
The diffusion coefficients for the thick and thin membrane slices are exactly the same. This diffusion coefficient is much lower than free diffusion (several orders of magnitude), but this doesn’t pose much of a problem in the thin simulation because the molecule only has to make a very short step across the membrane in this case. For the thicker membrane the movement of the molecule is much slower through the entire slice.