Macrophage Culture in the hToC Collagen I Gels Results in Decreased Macrophage Marker Expression
Introduction
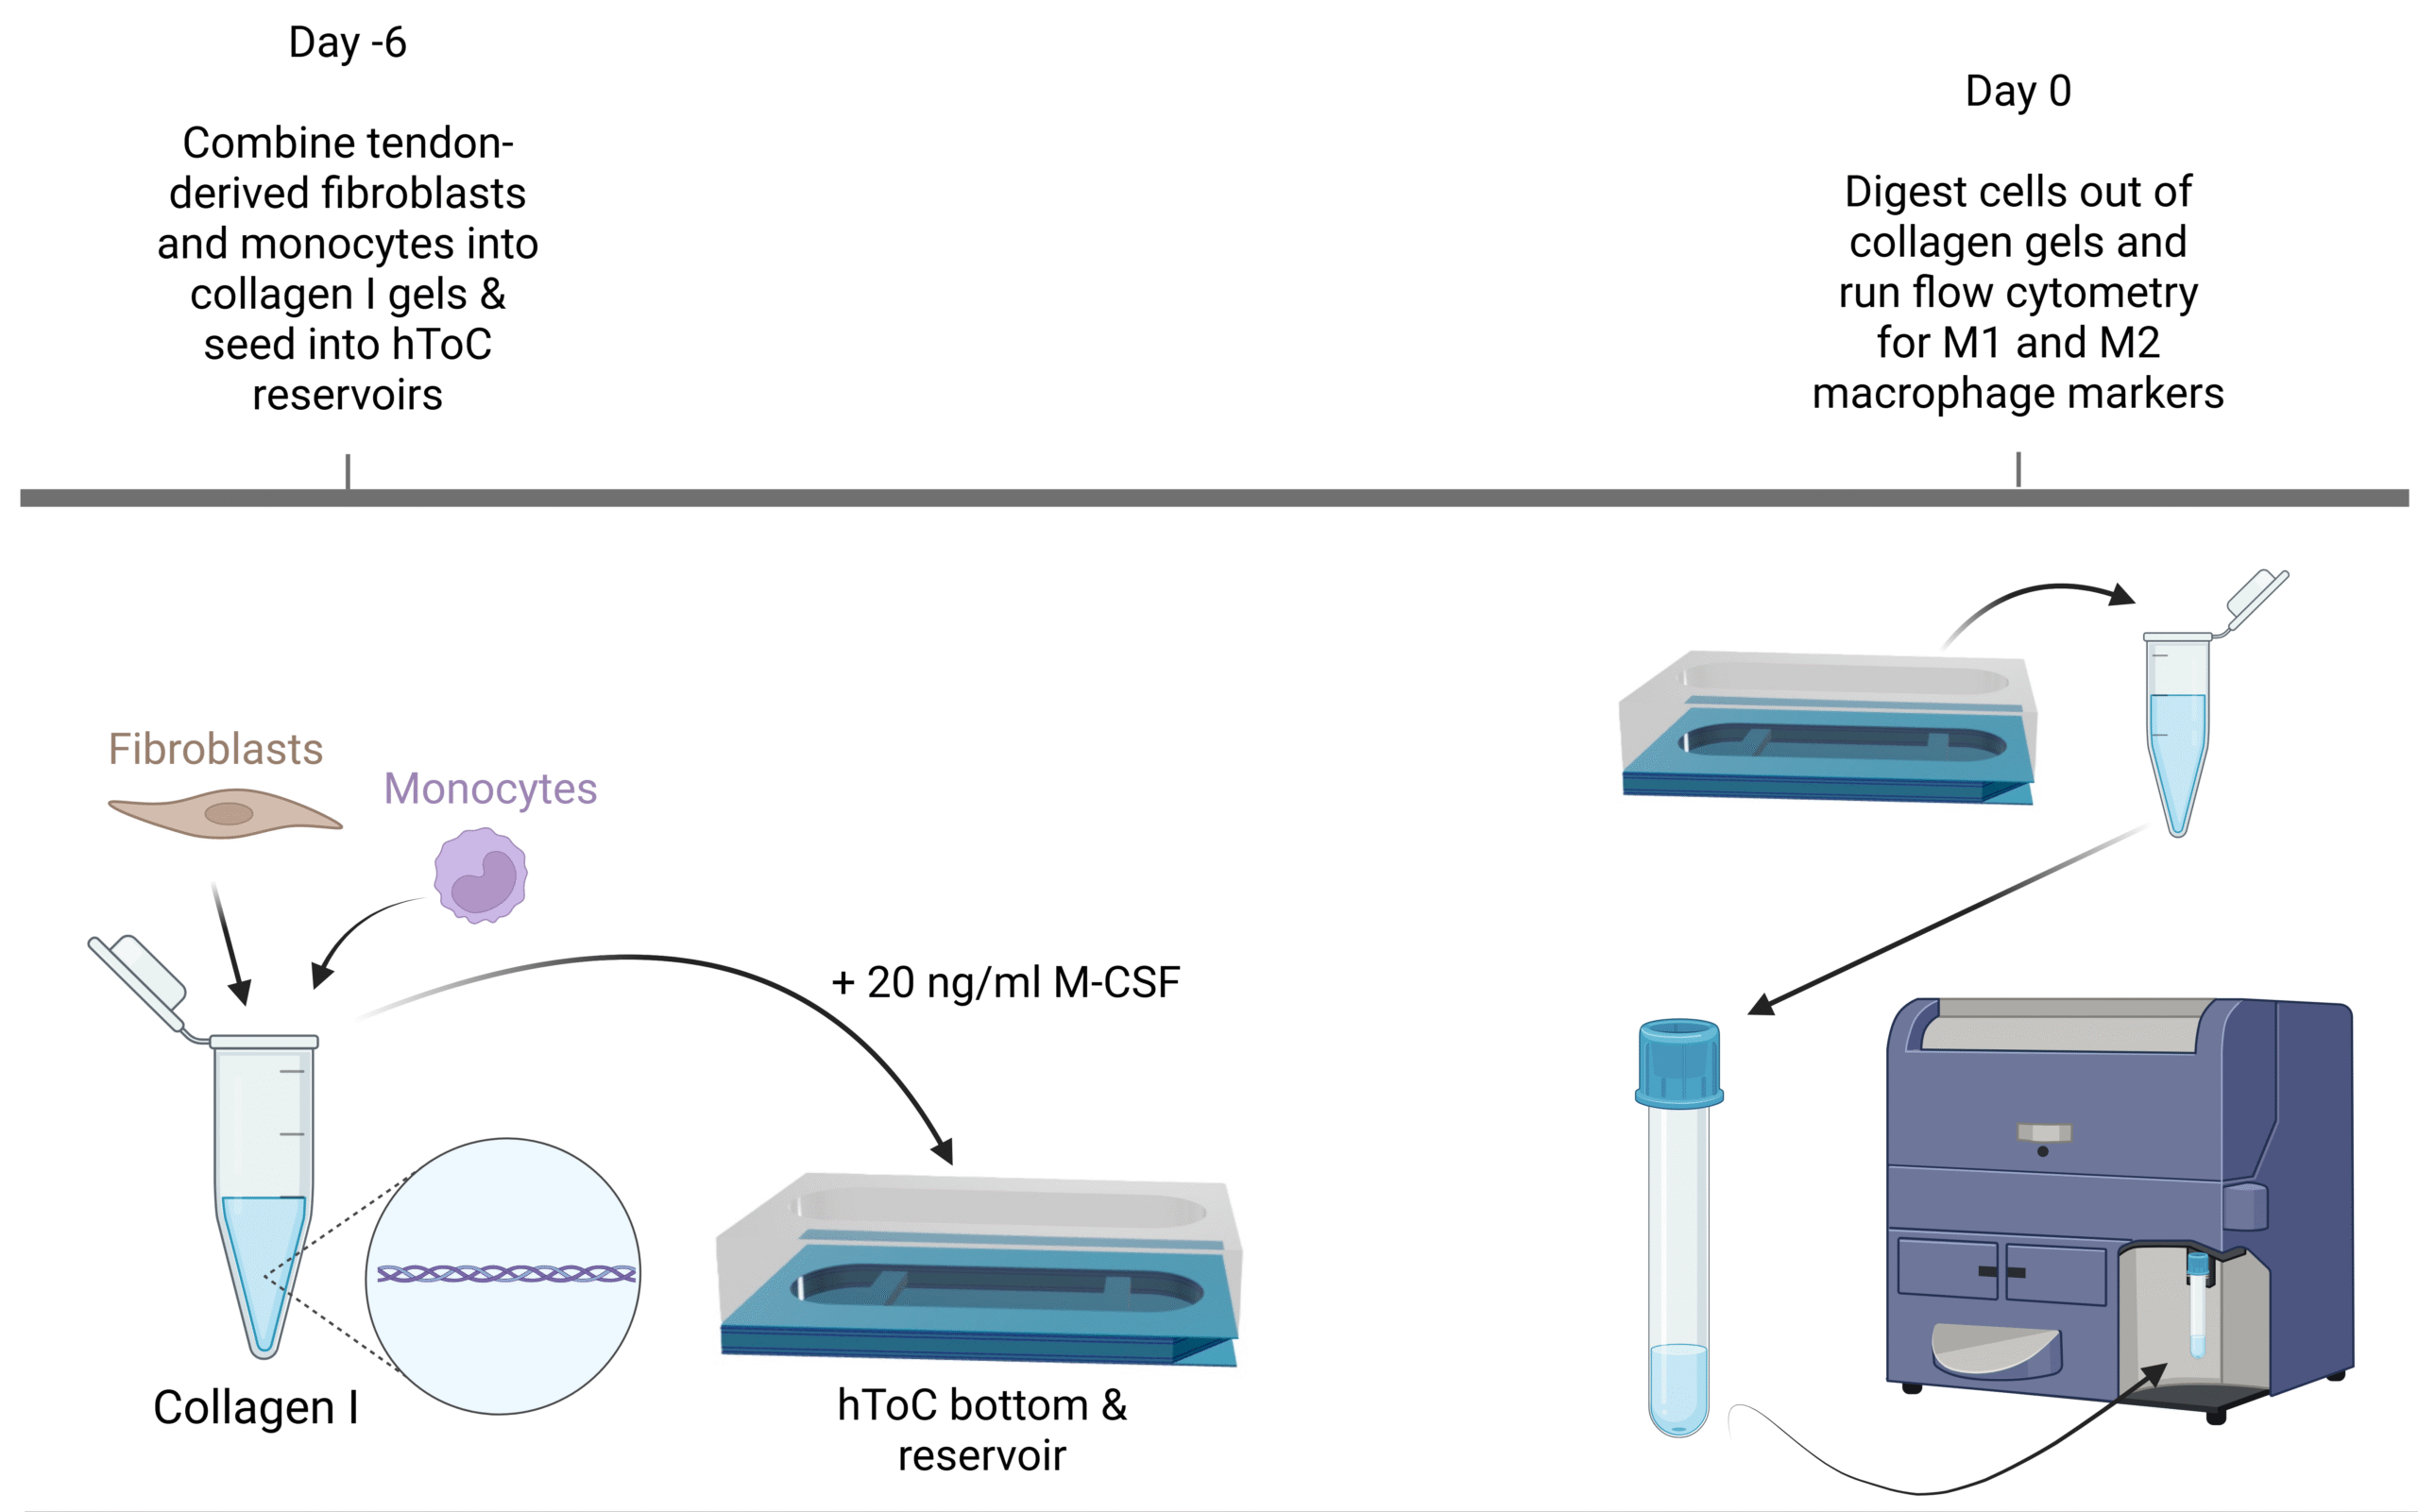
I recently established the feasibility of digesting cells out of the collagen I gels in the hToC bottom channels and reservoirs to use for flow cytometry. This involved using collagenase I and dispase II to digest fibroblasts and macrophages out of the collagen gel and running flow cytometry to evaluate macrophage marker expression. The goal was to evaluate M1 and M2 marker expression in iMonocytes and PB monocytes. After this success, we decided to run this macrophage panel on PB monocytes freshly isolated from whole blood and iMonocytes freshly thawed from cryopreservation. We hypothesized that culture in the hToC would cause an increase in macrophage marker expression compared to freshly harvested monocytes.
Methods
Setting up hToC devices
PB monocytes were isolated from whole blood from healthy donors using the SepMate PBMC isolation tubes from StemCell Tech and CD14 magnetic microbeads. iMonocytes were thawed from cryopreservation into RPMI media +10% FBS and 0.5% P/S. HTEN051 fibroblasts were used from a confluent T175 flask. Fibroblasts were suspended in collagen I hydrogels at 500,000 cells/ml and either PB monocytes or iMonocytes were added to the suspension at a ratio of 2:1 fibroblasts to monocytes. The seeding density of fibroblasts was determined based on previous hToC protocols1, 2. The ratio of 2:1 fibroblasts to monocytes was determined based on tendon healing studies in an in vitro model and in vivo mouse model3, 4. Once fibroblasts and either PB monocytes or iMonocytes were combined in the collagen I gel, 100 µl of the gel suspension was added to the hToC channels with 200 µl of X-VIVO media + 20 ng/ml macrophage colony stimulating factor (M-CSF). M-CSF was added to polarize monocytes into M0 macrophages. Devices were cultured for 6 days (Day-6 – Day 0) according to previous protocols2 and on Day 0, devices were digested out of gels for flow cytometry. The workflow is shown in Figure 1.
Digesting cells out of collagen gels
To digest fibroblasts and macrophages out of the gels, gels were submerged in 1 mg/ml collagenase I and 2 mg/ml dispase for 45-60 minutes at 37 °C to release cells. Midway through the incubation, cells were pipetted up and down and vortexed to allow for mechanical digestion. After incubation, cells were pipetted up and down once more and passed through a 70 µm strainer to ensure a single cell suspension. Filters were then washed with X-VIVO media and cells were pelleted to remove collagen.
Staining for flow cytometry
For both cells digested from hToC devices and freshly thawed/isolated monocytes, cells were resuspended in 80 µl FACS buffer and 20 µl FcR blocking reagent per sample. Cells were incubated with blocking reagent for 10 minutes on ice and after incubation, antibodies were added to each sample based on the manufacturer’s recommendation (Table 1).
Table 1. Recommended antibody volume added per sample.
| Antibody | CD45 APC-CF750 | CD36 Alexa Fluor 647 | CD86 Brilliant Blue 515 | CD206 Brilliant Violet 786 | CD169 Brilliant Violet 480 | CD90 RealBlue 705 |
| Volume (µl) in 100 µl staining volume | 3 µl/million cells | 5 µl/million cells | 5 µl/million cells | 1 µl | 1 µl | 3 µl/million cells |
For monocytes freshly isolated/thawed, CD90 antibody was excluded since there was no need to distinguish the fibroblast population from the macrophage population since there were no fibroblasts in the samples. All samples (cells harvested from hToCs and fresh cells) were incubated with antibodies for 30 minutes on ice. Samples were then centrifuged at 300 x g for 5 minutes and washed 3 times. Approximately 10 minutes before going to the flow cytometer, propidium iodide (live/dead stain) was added at 10 µg/ml. Single stain and fluorescence minus one controls were made using PB macrophage hToC samples and PB monocyte samples based on which experiment was being run. Analysis was done in FlowJo v11.
Results
The goal of the experiment was to determine if culturing monocytes in the hToC bottom for 6 days would increase marker expression for macrophages. All cells were gated for size and complexity based on forward and side scatter as well as for single cells based on forward scatter area and forward scatter height. Gating for live cells was also done. For samples harvested from the hToC, additional gating for CD90- cells was done to negatively select the macrophage population. Culture in the hToC for 6 days caused reduced marker expression for all markers (Figure 2).
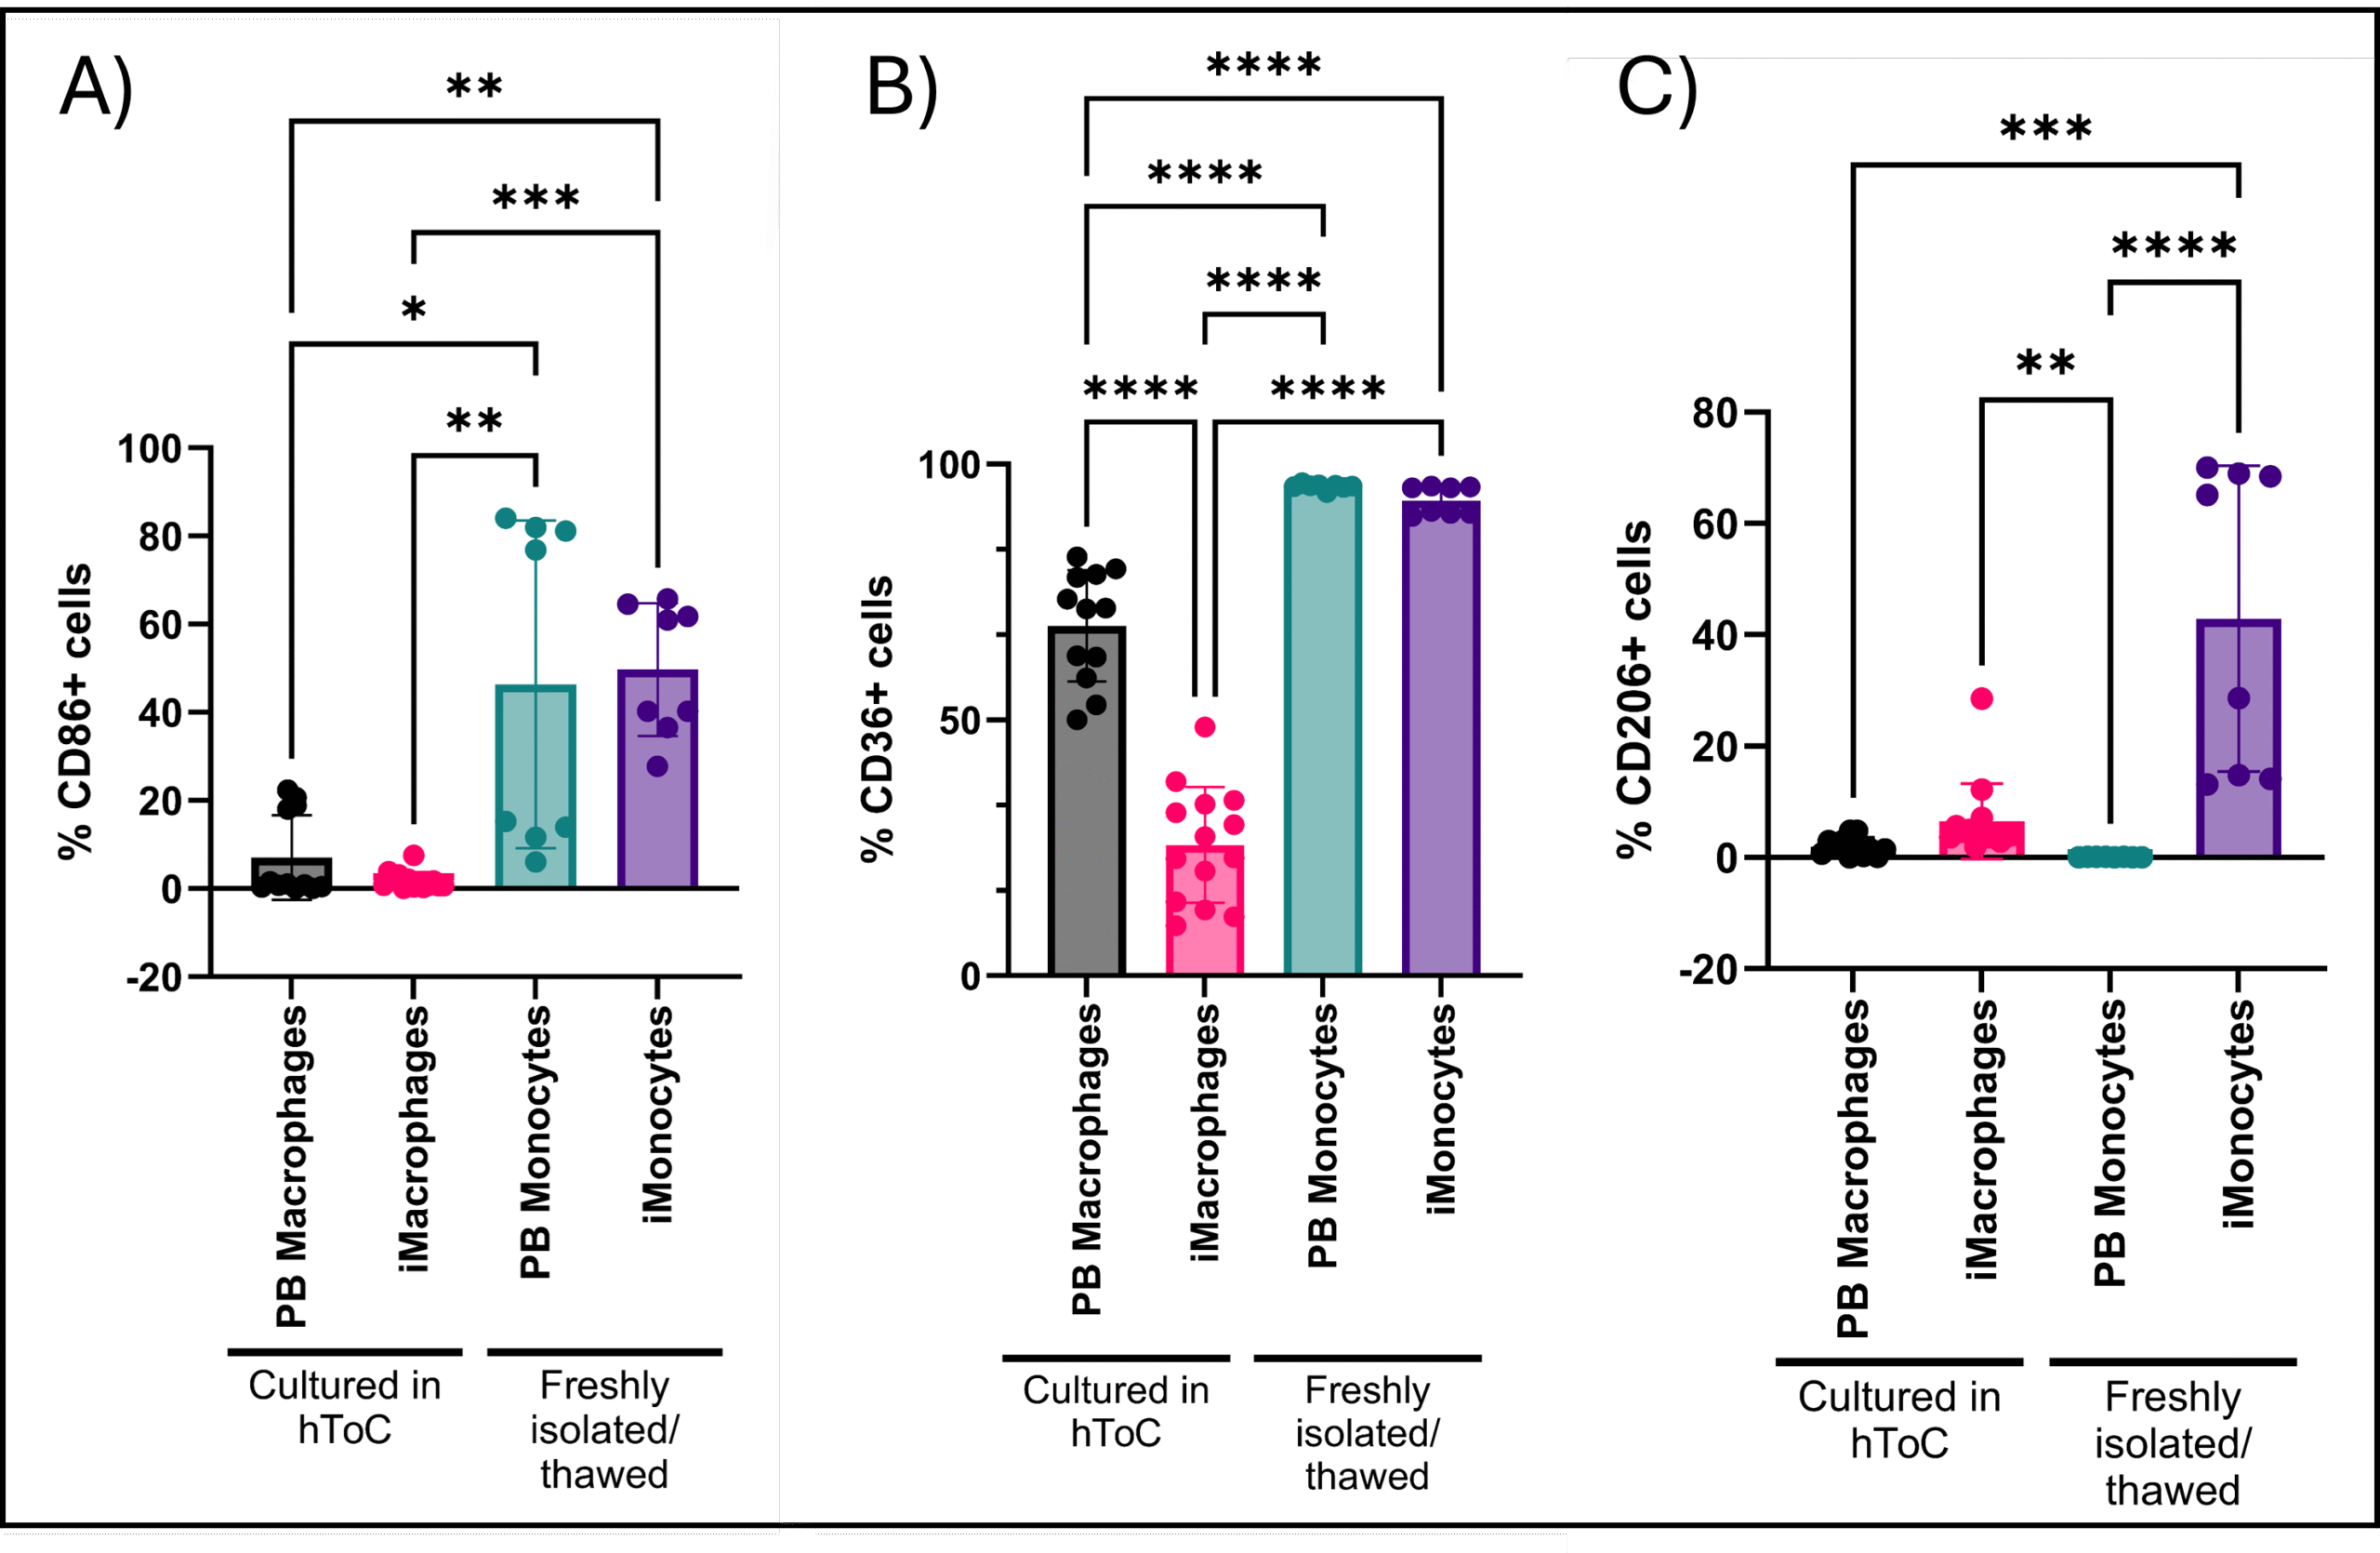
A significantly greater percentage of fresh PB and iMonocytes expressed CD86 compared to cultured PB and iMacrophages (Figure 2A). There was also no significant difference in percent expression between the two different cell populations within their group (hToC culture or fresh) (Figure 2A). There is also a heterogeneous expression of CD86 in the fresh monocyte populations. CD36 expression was less heterogeneous across all of the samples, but expression was still significantly greater in the fresh monocytes compared to cultured macrophages (Figure 2B). There was also a significantly higher percentage of cultured PB macrophages that expressed CD36 compared to cultured iMacrophages (Figure 2B). In both the cultured iMacrophages and fresh iMonocytes, there was a greater percentage of CD206+ cells compared to PB monocytes (Figure 2C). There was no significant difference in percentage of positive cells between cultured iMacrophages and fresh iMonocytes (Figure 2C). Overall, all marker expressions appeared lower in the cultured cell populations compared to the fresh cells.
Discussion
The results ended up being the opposite of our hypothesis. Culturing cells in the hToC gels resulted in a lower percentage of macrophages expressing the macrophage markers of interest. The markers CD86 and CD36 were chosen because they are both associated with M1 macrophage polarization and contributing to the inflammatory response5,6. CD206 was chosen because it is associated with M2 macrophage polarization which are more anti-inflammatory6. iMonocytes/iMacrophages are more similar to tissue resident macrophages because they are generated from protocols that mimic development of cells that are derived from the yolk sac7. Tissue resident macrophages are associated with resolution of inflammation, therefore we hypothesized that iPSC-derived monocytes/macrophages would show higher expression of M2 markers (CD206)8. Figure 2C demonstrates this to be true, although once again marker expression is much more muted after macrophage culture in the hToC gels. For all hToC cultured macrophages, less than 20% of cells expressed the markers of interest except for CD36 (Figure 2). One of the ligands of CD36 is collagen I, so it is likely that culture in the hToC collagen I gels caused the CD36 expression to be higher than 20% in both the PB macrophage and iMacrophage populations9. Overall, hToC culture caused muted marker expression in the PB macrophage and iMacrophage populations. It is possible that the macrophages are not contributing much to the overall microenvironment in these devices. It is also possible that the macrophages are not in their ideal culture conditions and are not fully polarizing to macrophages, resulting in less cells expressing these macrophage markers of interest. Finally, none of the factors that generally induce macrophage polarization were added to the culture such as LPS and IFN-γ and LPS for M1 and IL-4 for M210. The goal of the initial experiment was to determine if PB macrophages and iMacrophages were inherently more pro- or anti-inflammatory, therefore these factors were not added. It is possible that there was no polarization to these macrophage subtypes and that macrophages were more M0-like in these cultures.
References
- Ajalik RE, Linares I, Alenchery RG, Zhang VZ, Wright TW, Miller BL, McGrath JL, Awad HA. Human Tendon-on-a-Chip for Modeling the Myofibroblast Microenvironment in Peritendinous Fibrosis. Advanced Healthcare Materials. 2025;14(4):2403116. doi: https://doi.org/10.1002/adhm.202403116.
- Linares I, Chen K, Saffren A, Mansouri M, Abhyankar VV, Miller BL, Begolo S, Awad HA, McGrath JL. Fluid flow impacts endothelial-monocyte interactions in a model of vascular inflammatory fibrosis. Scientific Reports. 2025;15(1):3227. doi: 10.1038/s41598-025-85987-z.
- Ackerman JE, Nichols AE, Studentsova V, Best KT, Knapp E, Loiselle AE. Cell non-autonomous functions of S100a4 drive fibrotic tendon healing. Elife. 2019;8. Epub 20190524. doi: 10.7554/eLife.45342. PubMed PMID: 31124787; PMCID: PMC6546390.
- Wong JKF, Lui YH, Kapacee Z, Kadler KE, Ferguson MWJ, McGrouther DA. The Cellular Biology of Flexor Tendon Adhesion Formation: An Old Problem in a New Paradigm. The American Journal of Pathology. 2009;175(5):1938-51. doi: https://doi.org/10.2353/ajpath.2009.090380.
- Silverstein RL, Febbraio M. CD36, a scavenger receptor involved in immunity, metabolism, angiogenesis, and behavior. Sci Signal. 2009;2(72):re3. Epub 20090526. doi: 10.1126/scisignal.272re3. PubMed PMID: 19471024; PMCID: PMC2811062.
- Chen S, Saeed AFUH, Liu Q, Jiang Q, Xu H, Xiao GG, Rao L, Duo Y. Macrophages in immunoregulation and therapeutics. Signal Transduction and Targeted Therapy. 2023;8(1):207. doi: 10.1038/s41392-023-01452-1.
- Cao X, Yakala GK, van den Hil FE, Cochrane A, Mummery CL, Orlova VV. Differentiation and Functional Comparison of Monocytes and Macrophages from hiPSCs with Peripheral Blood Derivatives. Stem Cell Reports. 2019;12(6):1282-97. doi: 10.1016/j.stemcr.2019.05.003. PubMed PMID: 31189095; PMCID: PMC6565887.
- Wynn TA, Vannella KM. Macrophages in Tissue Repair, Regeneration, and Fibrosis. Immunity. 2016;44(3):450-62. doi: 10.1016/j.immuni.2016.02.015. PubMed PMID: 26982353; PMCID: PMC4794754.
- Janabi M, Yamashita S, Hirano K-i, Matsumoto K, Sakai N, Hiraoka H, Kashiwagi H, Tomiyama Y, Nozaki S, Matsuzawa Y. Reduced Adhesion of Monocyte-Derived Macrophages from CD36-Deficient Patients to Type I Collagen. Biochemical and Biophysical Research Communications. 2001;283(1):26-30. doi: https://doi.org/10.1006/bbrc.2001.4718.
- Cao X, van den Hil FE, Mummery CL, Orlova VV. Generation and Functional Characterization of Monocytes and Macrophages Derived from Human Induced Pluripotent Stem Cells. Curr Protoc Stem Cell Biol. 2020;52(1):e108. doi: 10.1002/cpsc.108. PubMed PMID: 32159928; PMCID: PMC7154707.

Emily – Your opening line. We might have a nomenclature problem. These cultures were in the hToC bottom component. Not the reservoirs, right? Fix both posts if needed.
It was in both the bottom channel and the reservoir. I put the reservoir on top of the bottom channel and pipetted the collagen gel into it and cultured the cells in that over the 6 days. I’ll edit both posts to make it clear it was both