Towards Surface Enhanced Raman Functionalization of Nanopocket membranes
Towards Surface Enhanced Raman Functionalization of Nanopocket membranes
Introduction
Use of Raman microscopy is used to evaluate the chemical profile of substances. Surface enhanced Raman spectroscopy (SERS) is a signal-boosting techniques where the weak Raman signal is amplified through plasmon interactions at a metalized (often nanostructured) surface. SERS for extracellular vesicles (EVs) was recently shown. Analysis of the Raman spectra was sufficient to categorize EVs based upon their respective isolation method (ultracentrifugation, size exclusion chromatography, and differential gradient ultracentrifugation), and also from similar particles (chylomicrons, VLDL, LDL, and HLDL) DOI: 10.1039/d1nr03334d. Cancer EVs were characterized https://doi.org/10.1021/acssensors.0c00953
. Additionally EVs were distinguished into cancerous and non-cancerous subtypes DOI: 10.1039/d1nr03334d, https://doi.org/10.3390/cancers13092179.
We desire to incorporate Raman and especially SERS into our nanopocket membranes for the analysis of EVs and similar particles.
Experimental Approach
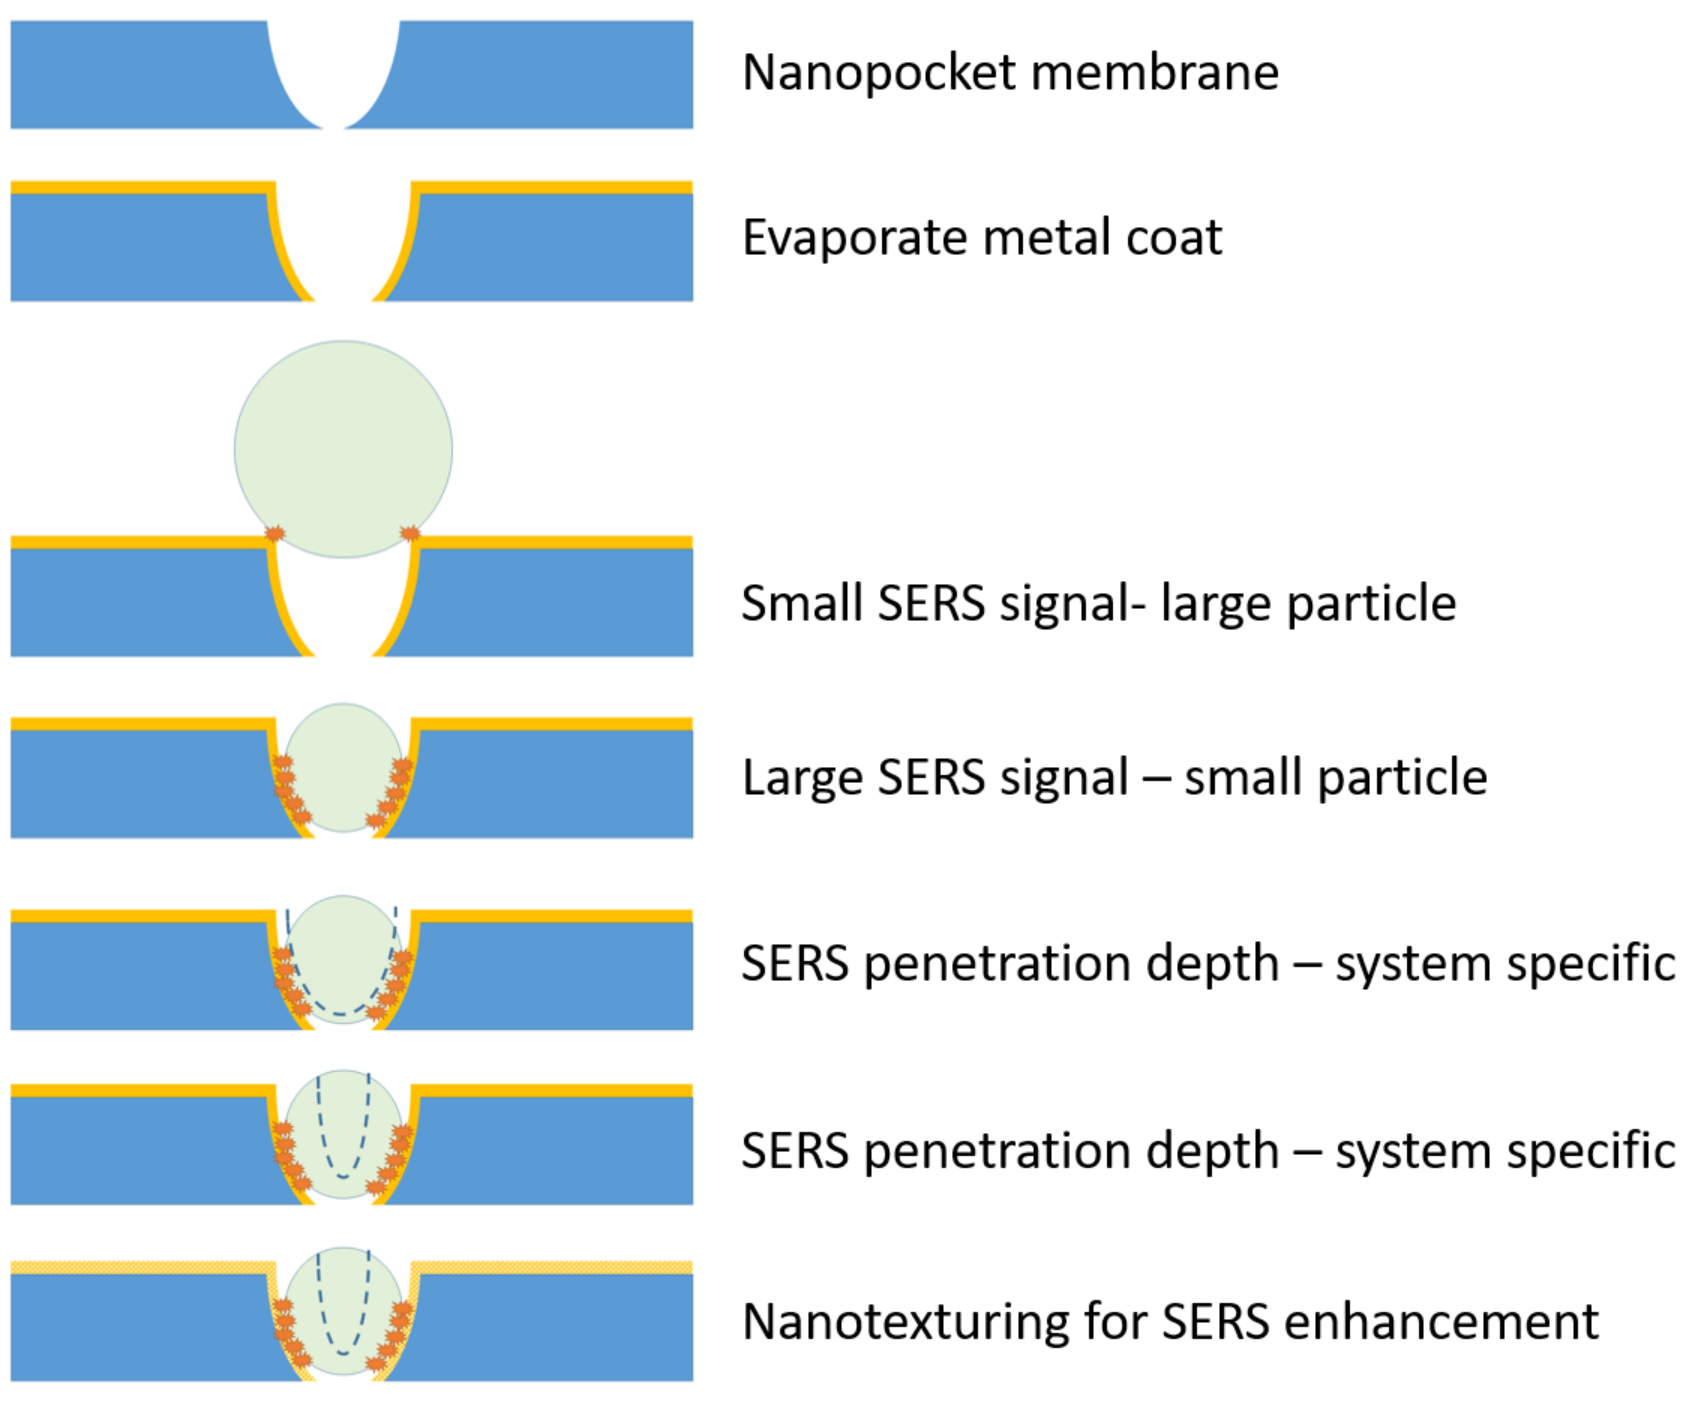
Figure 1. Nanopocket membranes may give surface-specific chemical information from populations of EVs based upon their size and fit within a nanopocket. Over-sized particles are expected to produce relatively less SERS signal because they do not form as many contact points with the surface-plasmon enhancing metalized surface. The SERS penetration depth is expected to be ~10 nanometers.
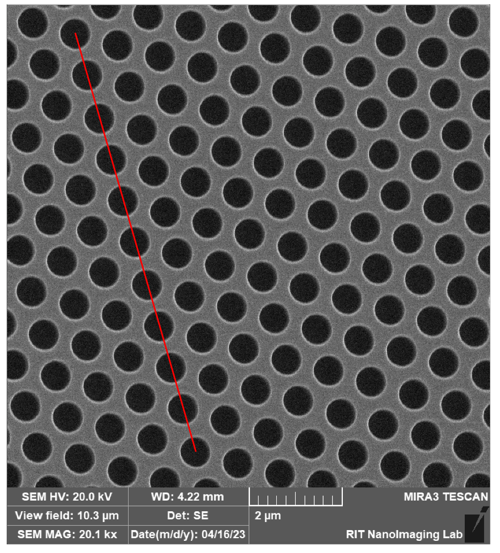
Figure 2. Nanopockets are appropriately spaced for the SERS probing of single nanopockets because the pore spacing is ~0.92 µm (from the mask) and the calculated spot size (which limits Raman resolution) is ~1.3 µm at 785 nm, with a 100 X (NA=0.73). The laser spot size = 1.22*λ/NA where λ is the laser wavelength, and NA is numerical aperture for the objective.
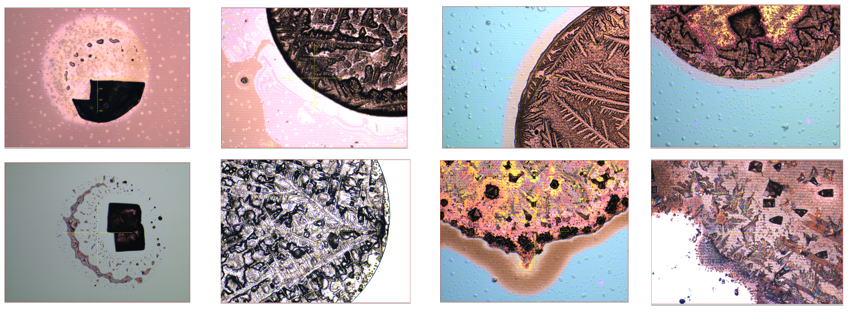
Figure 3. A dry droplet is very non-homogeneous with sequestered salts and chemicals in different locations of the surface (Coffee ring effect).
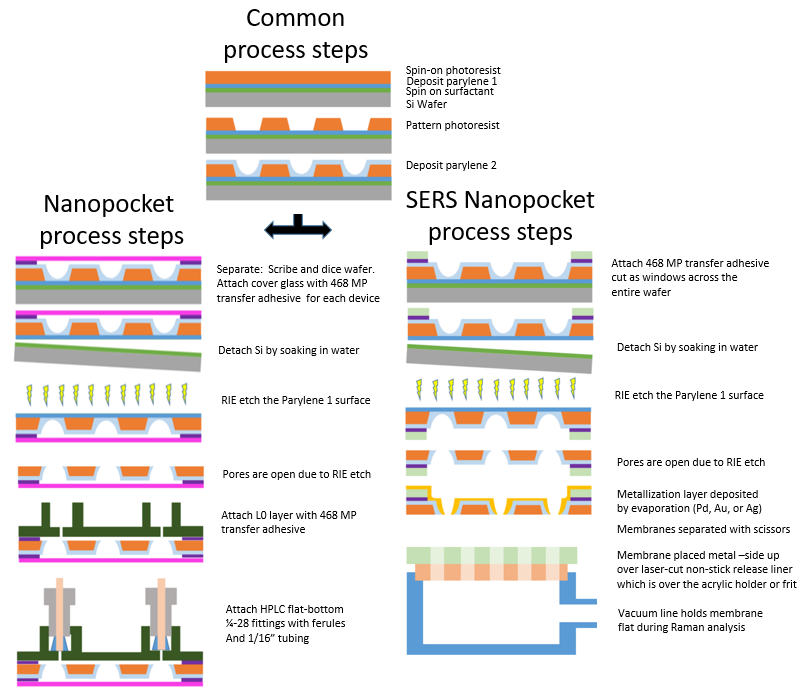
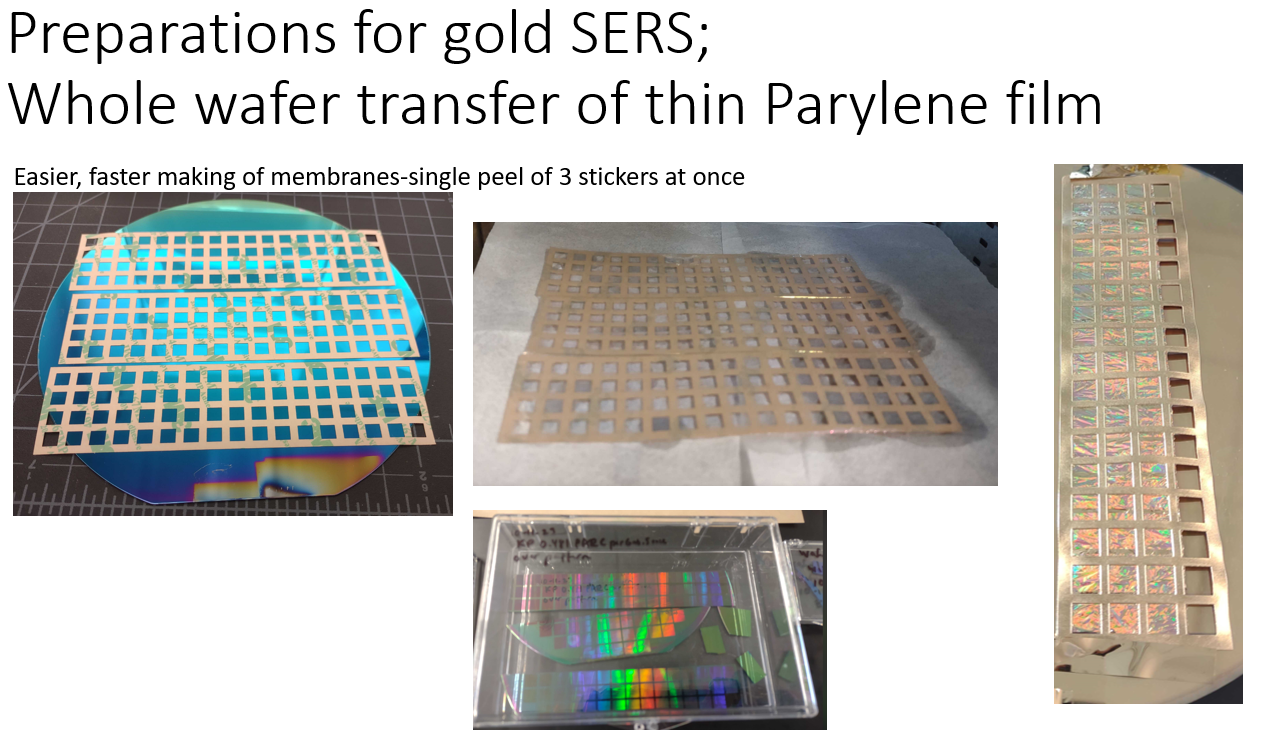
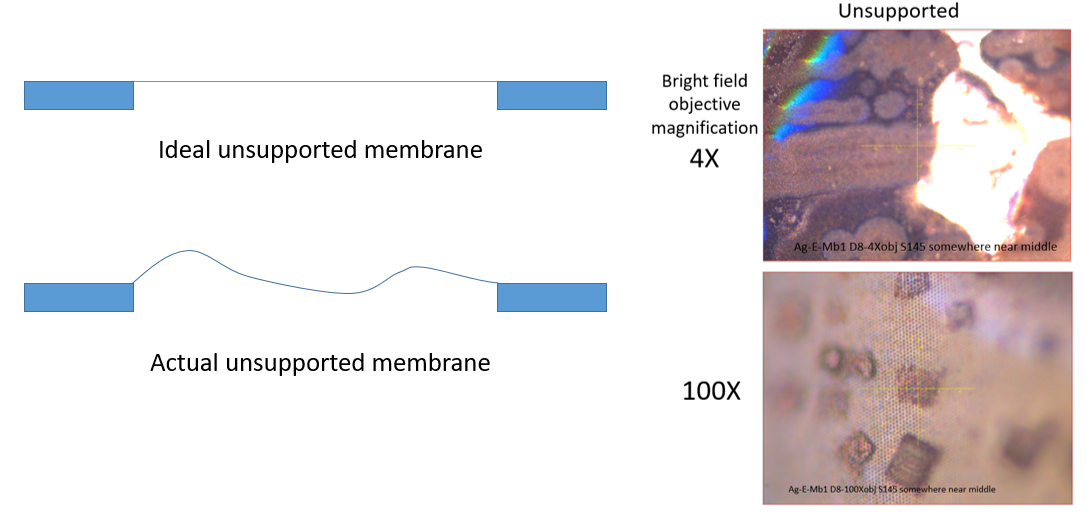
Figure 4. Unsupported membranes wiggle, move, and don’t lay perfectly flat, especially when heated by lasers
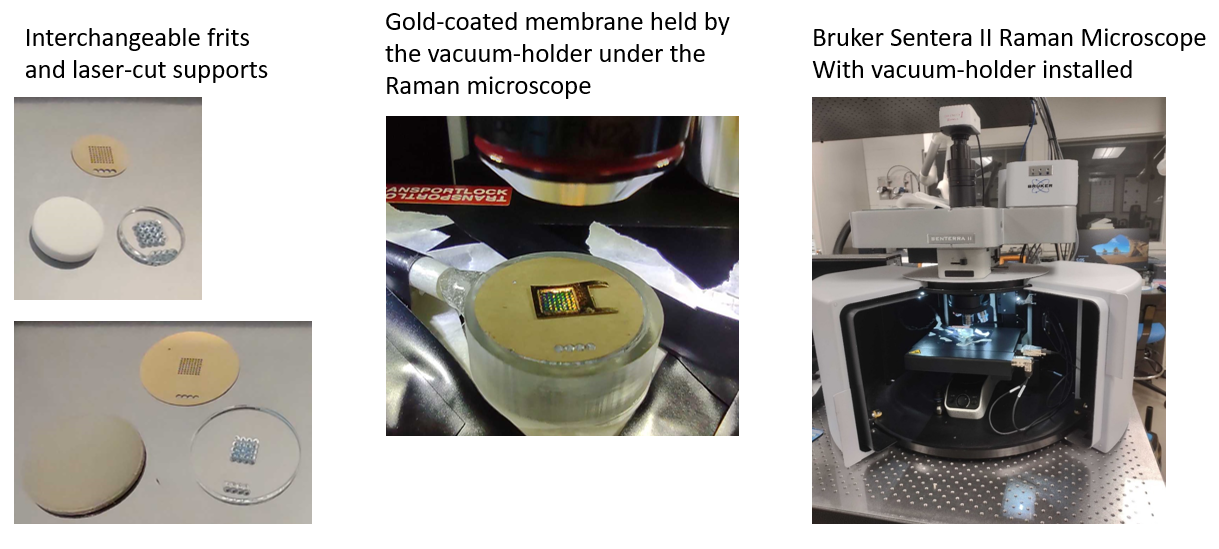
Figure 5. Applying a vacuum to stabilize the membrane during Raman measurements.
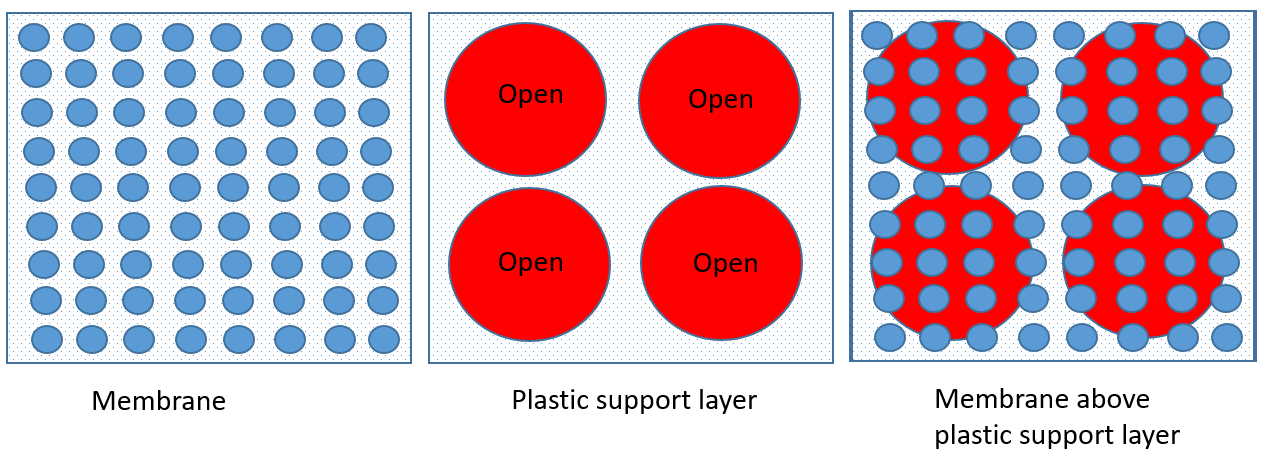
Figure 6. Schematic of water passage test with vacuum.
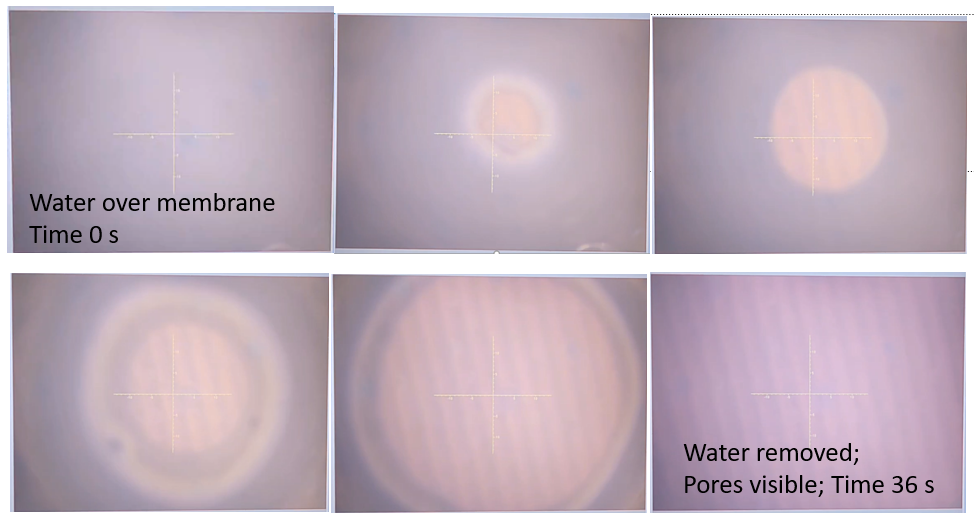
Figure 7. Screenshots from a video where water is pulled through the nanopocket membrane centered over a large circular relief in a plastic support layer (water passage test). Membrane is in focus prior to the addition of water. Water is pulled first from the center indicating that it was pulled through the membrane at the circular relief in the field of view and not from a site out of the field of view. The membrane does not crack and is visibly removed after 36 seconds.
Obtaining a reproducible signal from non-homogeneous spots has been a challenge. Rinsing them removed all Raman signal, applying Cysteamine (a positively charged surface modifier) did not improve signal of VLDLs on the surface either. Many papers sample especially near the edge due to the coffee ring effect.
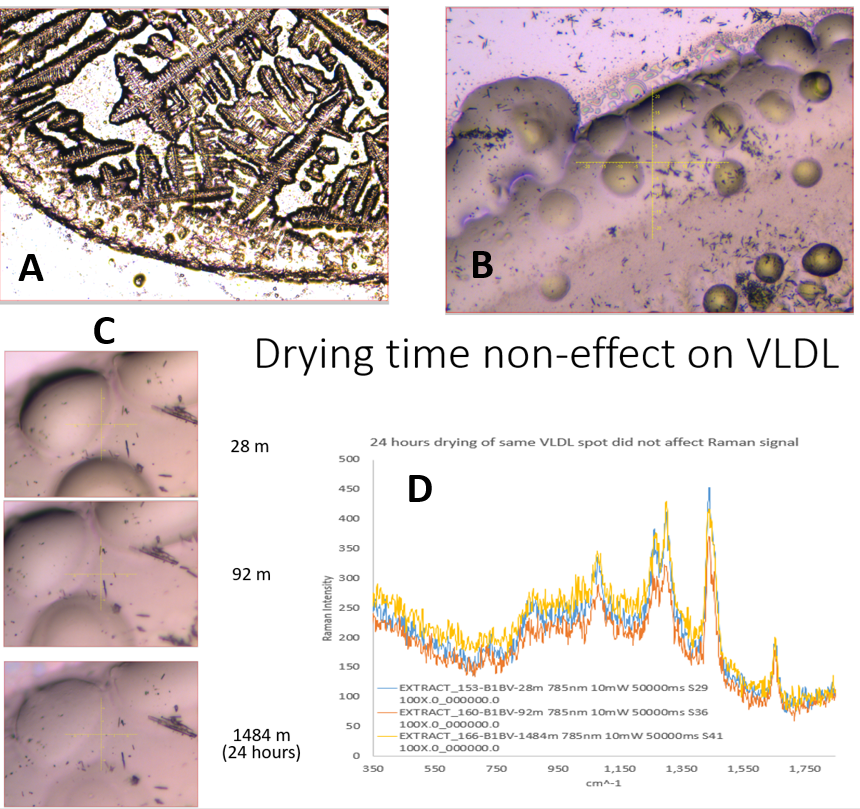
Figure 8. Drying time had no measurable effect on repeat measurements of a dried VLDL particle taken at the same location near the edge of the droplet from 28 minutes to 24 hours after placing on the surface. This was performed on a Pd metallized glass substrate.
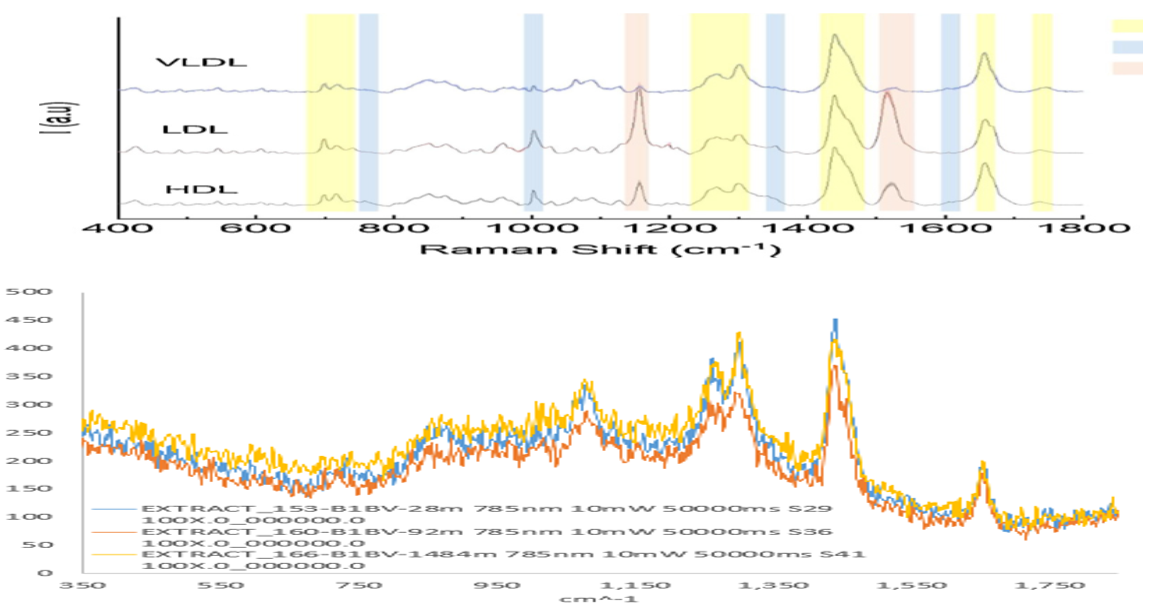
Figure 9. Published spectra for VLDL particles (top) vs. raw measured spectra for VLDL droplet (bottom) shows positive identification of VLDL by the peak position relative intensity values. Notice also the small difference in spectra associated with LDL and HDL particles. VLDL spectra taken using Pd metallized surface on glass. Adapted from: https://doi.org/10.1016/j.vibspec.2020.103073
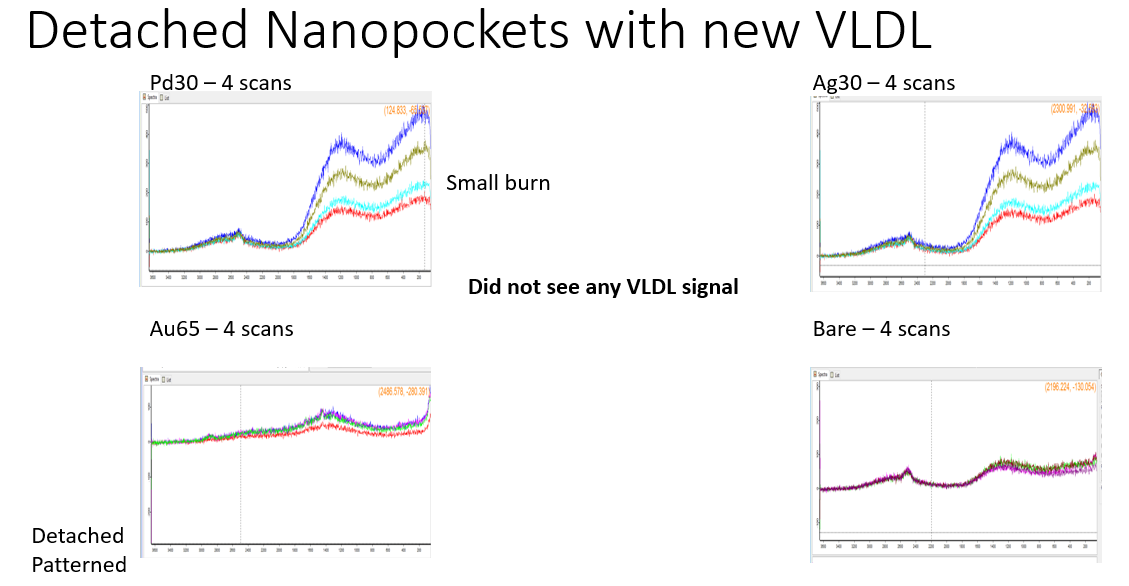
Figure 10. VLDL particles did not give recognizable Raman peaks on free (detached) nanopocket membranes coated in Pd, Ag, Au, or Bare surfaces.
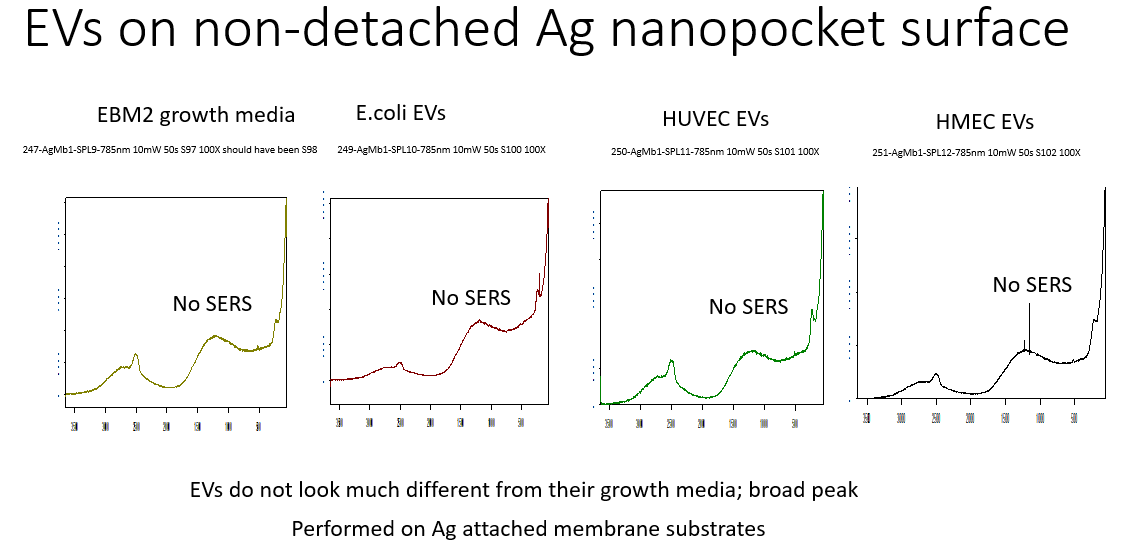
Figure 11. EVs did not give recognizable Raman peaks on nanopocket membranes metalized with Ag but still attached to the silicon. This signal from EVs was also not distinguishable from the growth media. It also had broad peaks in the fingerprint region where Raman peaks were expected.
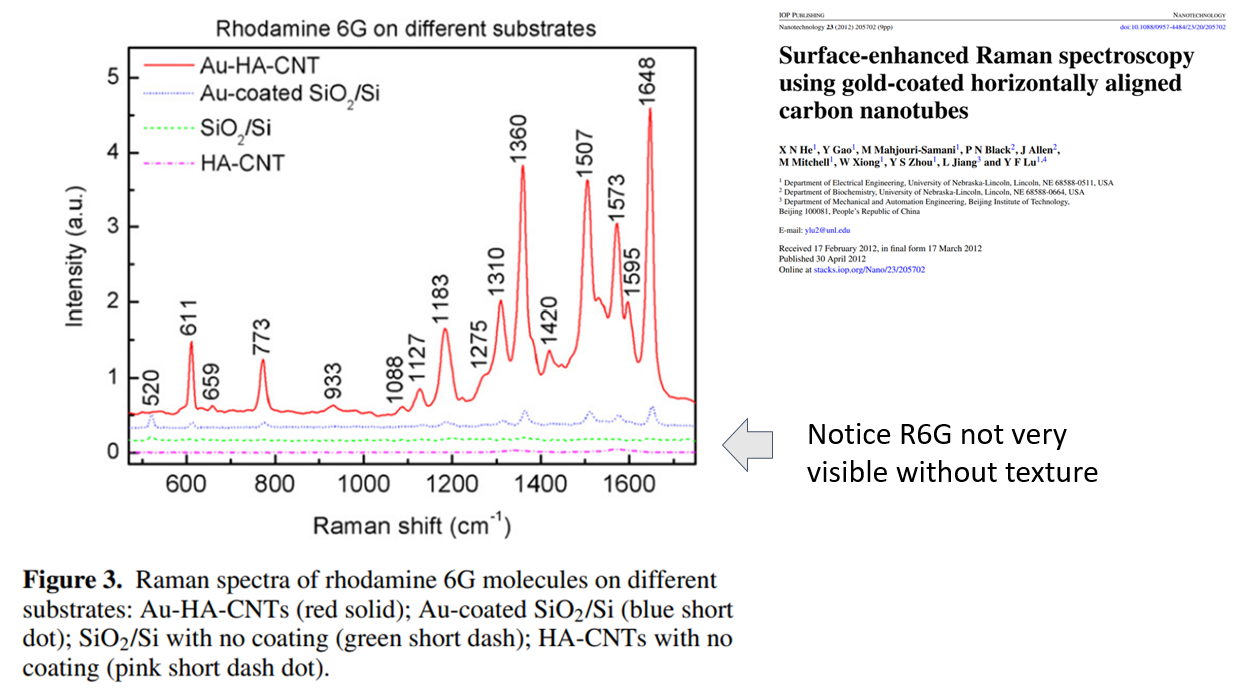
Figure 12. Small molecule Rhodamine 6G in a previous publication required texturing to achieve a high signal.
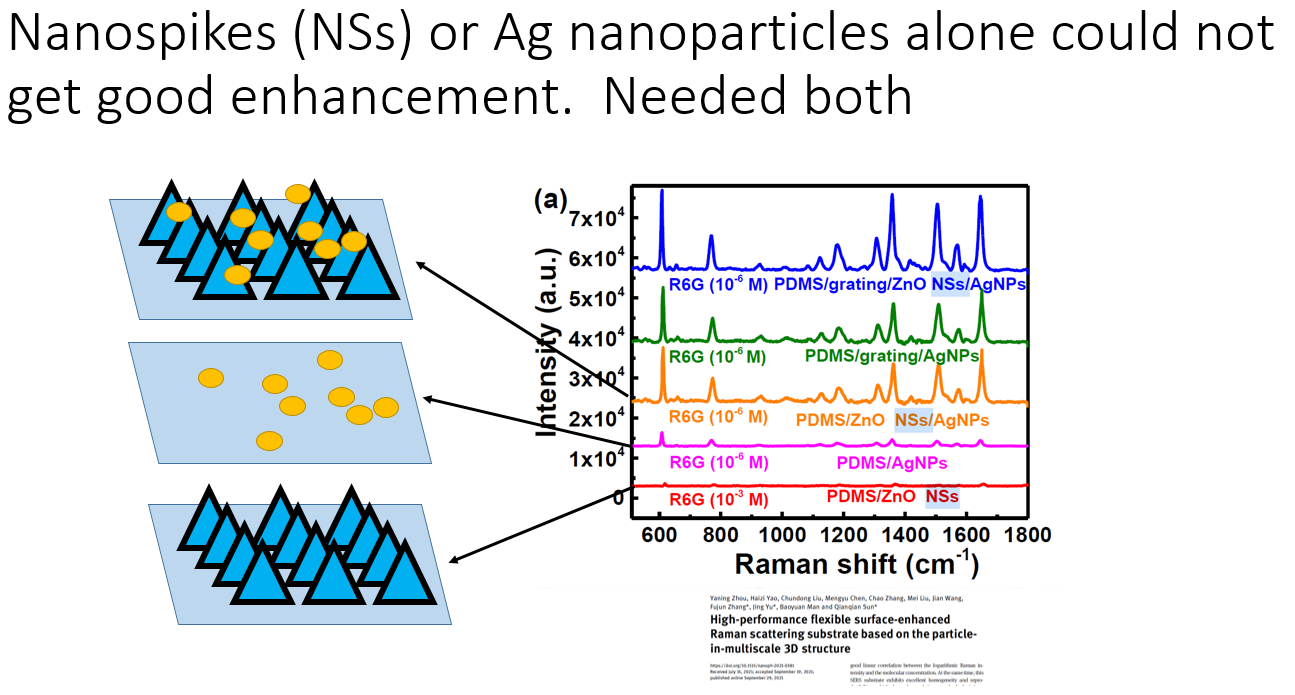
Figure 13. Nanospikes or Ag paticles alone could not get good enhancement from a previous publication. Both were required.
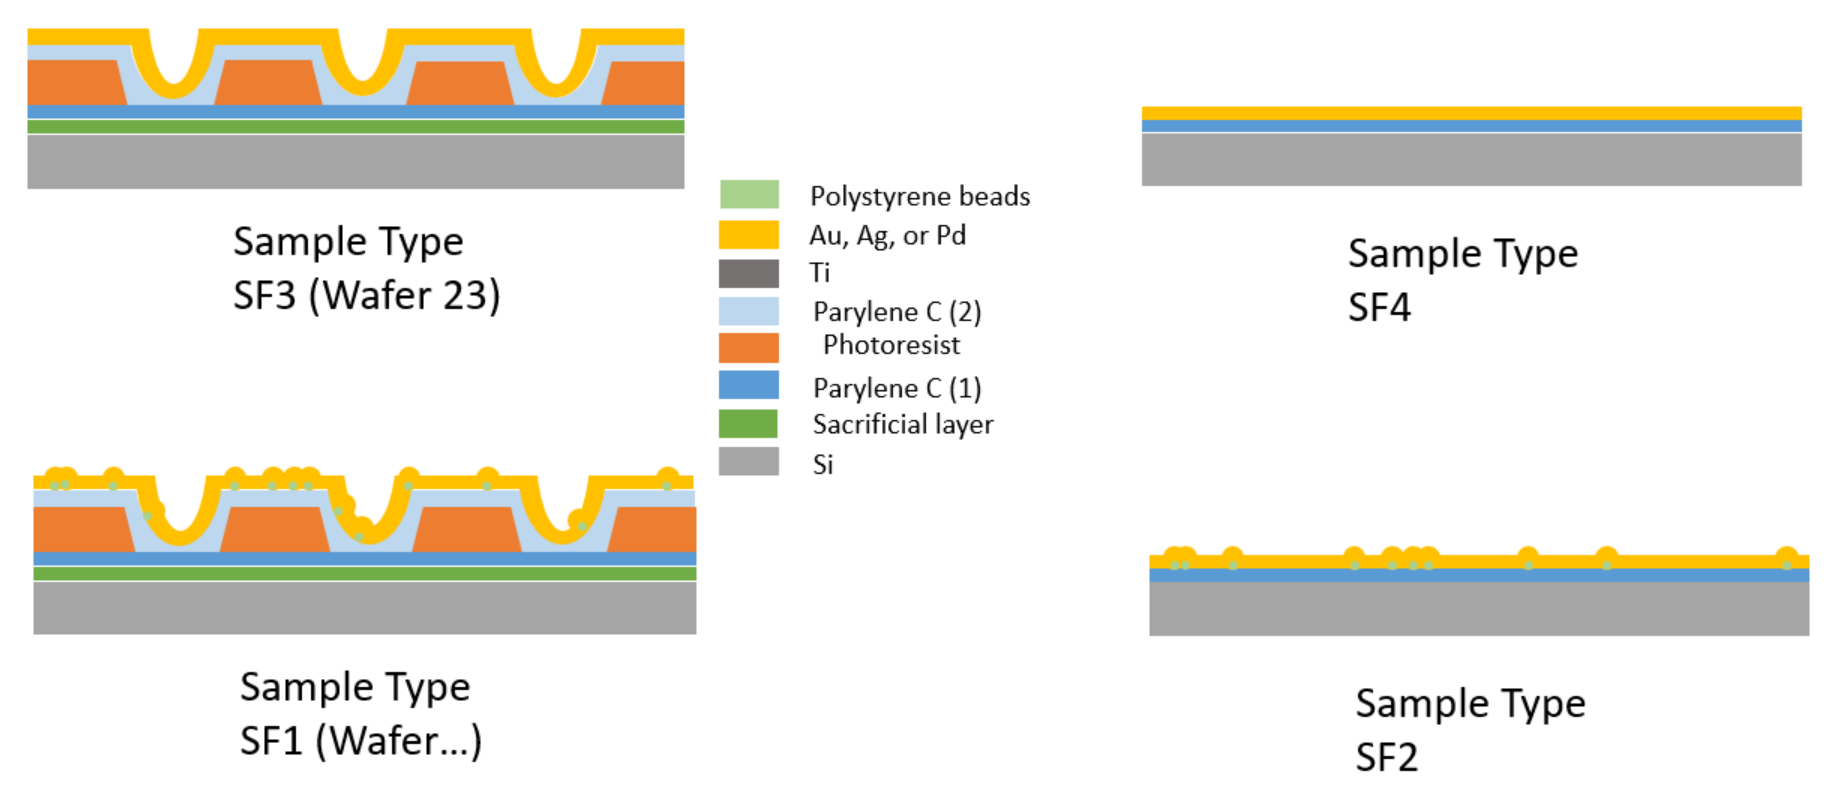
Figure 14. Surfaces we evaluated in subsequent tests.
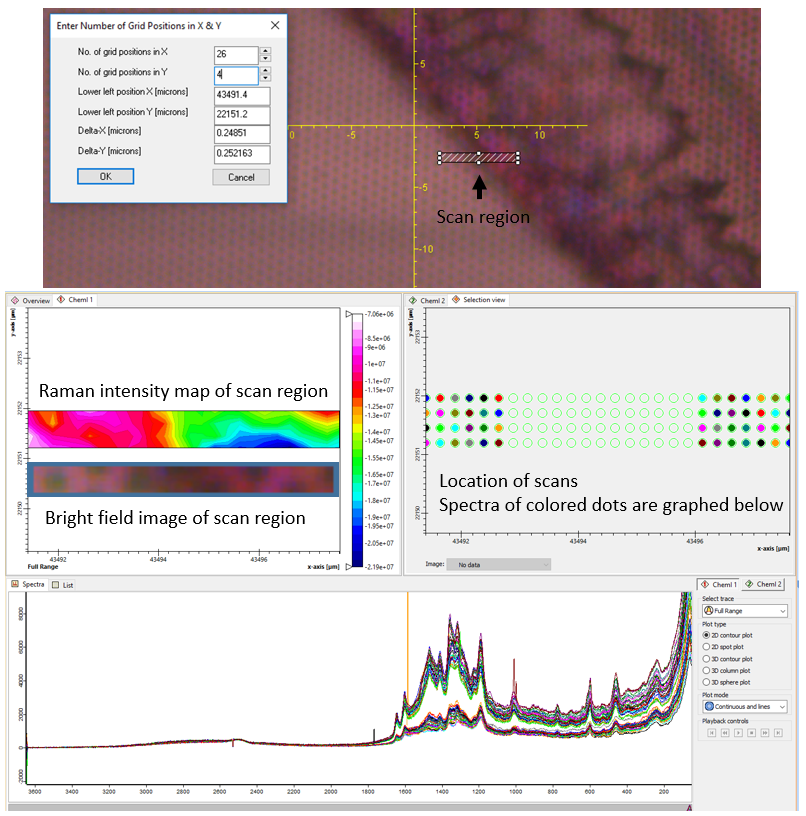
Figure 15. Raman spectra from 104 scans taken at 0.25 µm increments show transition from the surface to the edge of the Rhodamine 6G drop but do not show a distinction in the pores. Differences in the spectra do not show large intensity difference from pore to pore.
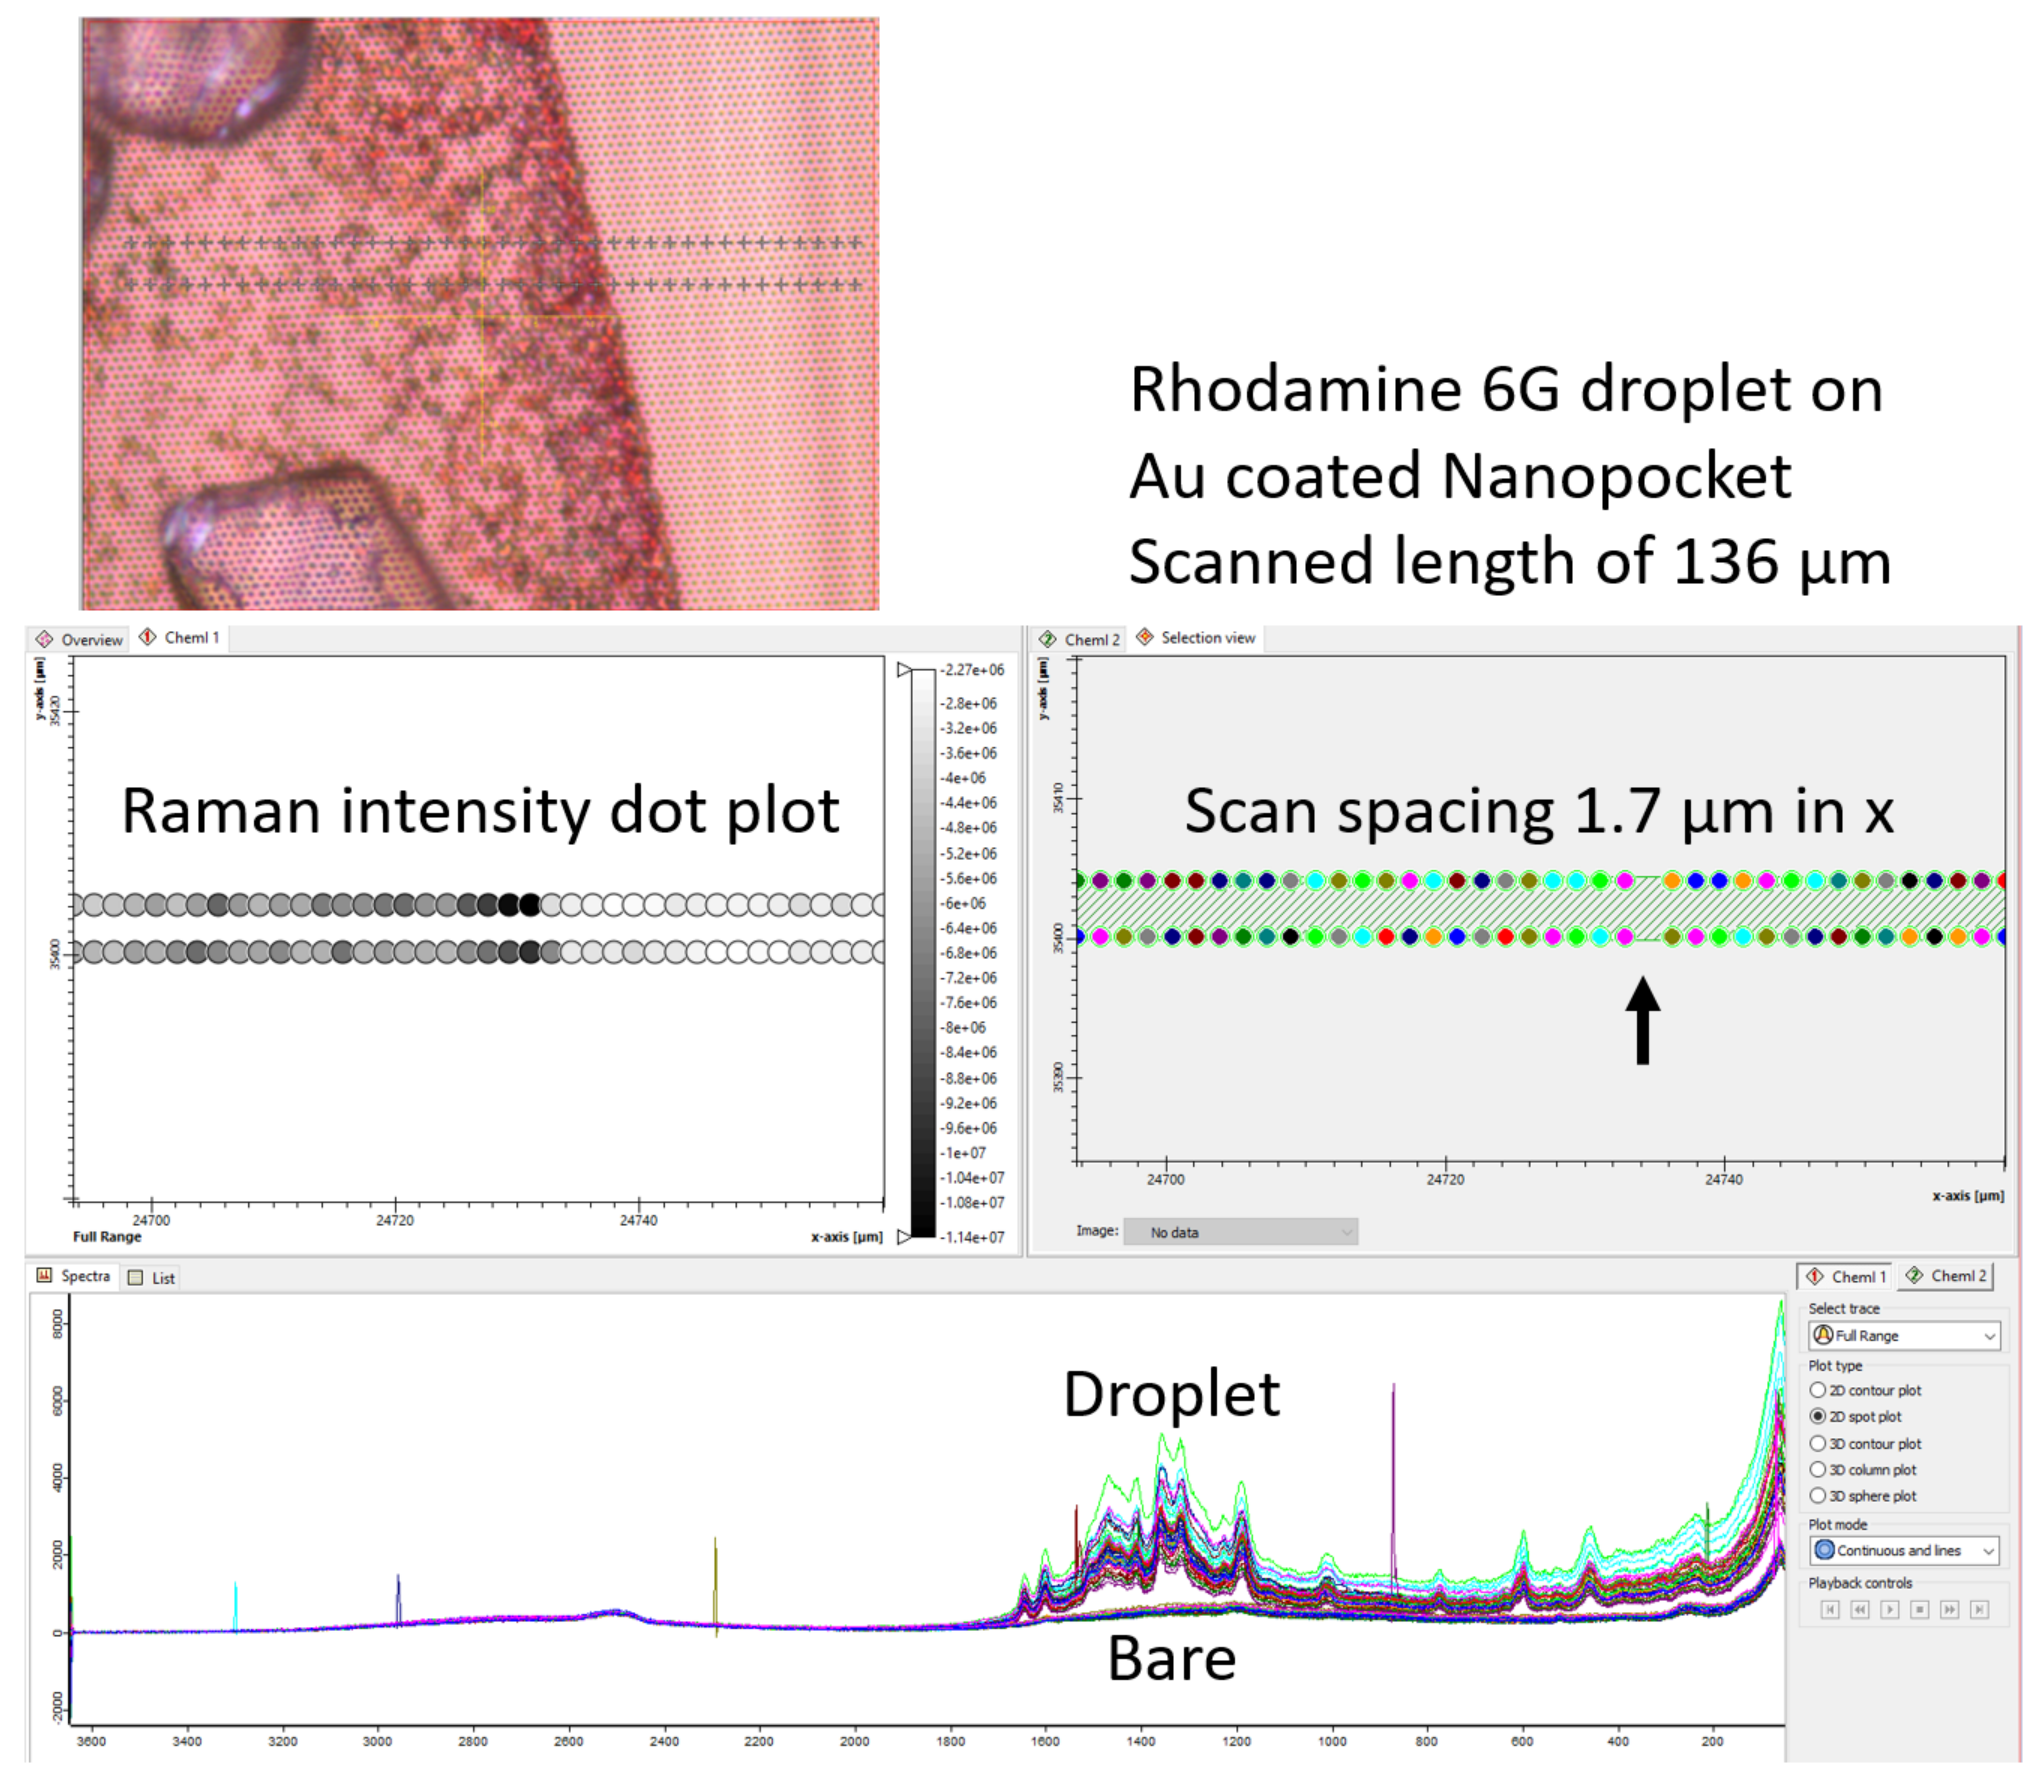
Figure 16. Raman spectra taken from 80 scans taken at 1.7 µm increment in x show an abrupt transition to the rhodamine 6G spectra in just one 1.7 µm step across the edge. The most intense region of Raman signal is just inside the apparent edge of the droplet
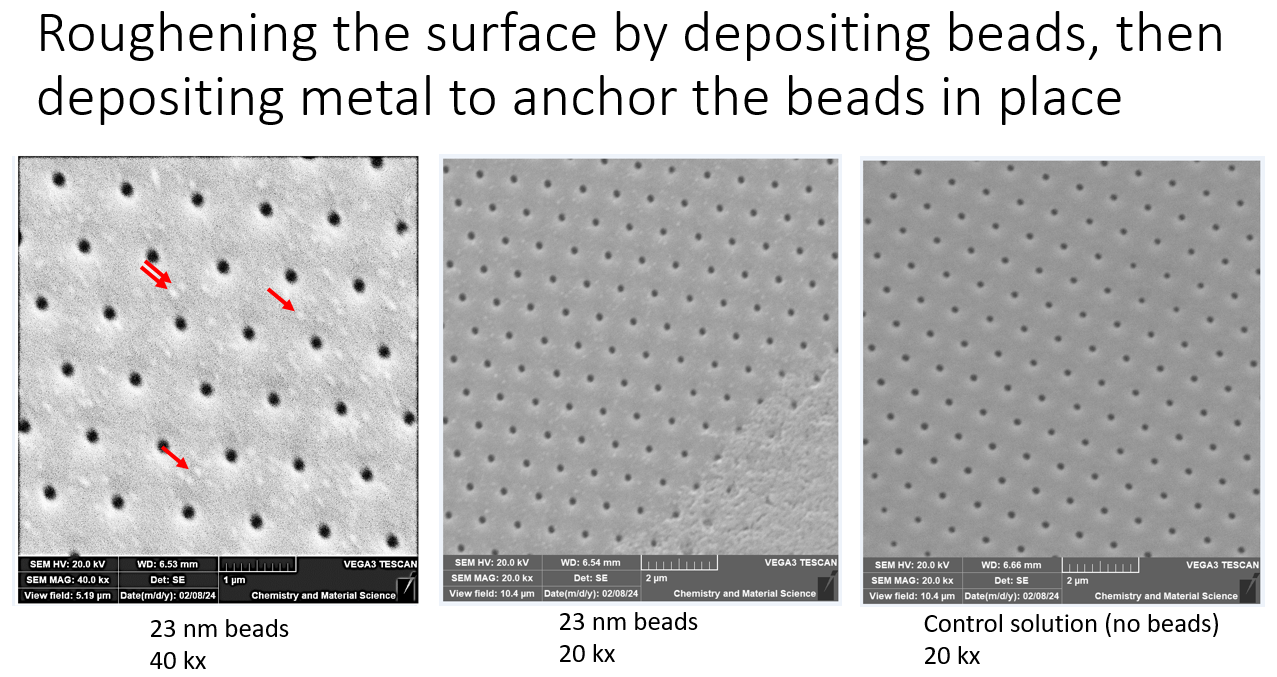
Figure 17. Increasing surface texture using 23 nm polystyrene beads under a Au layer
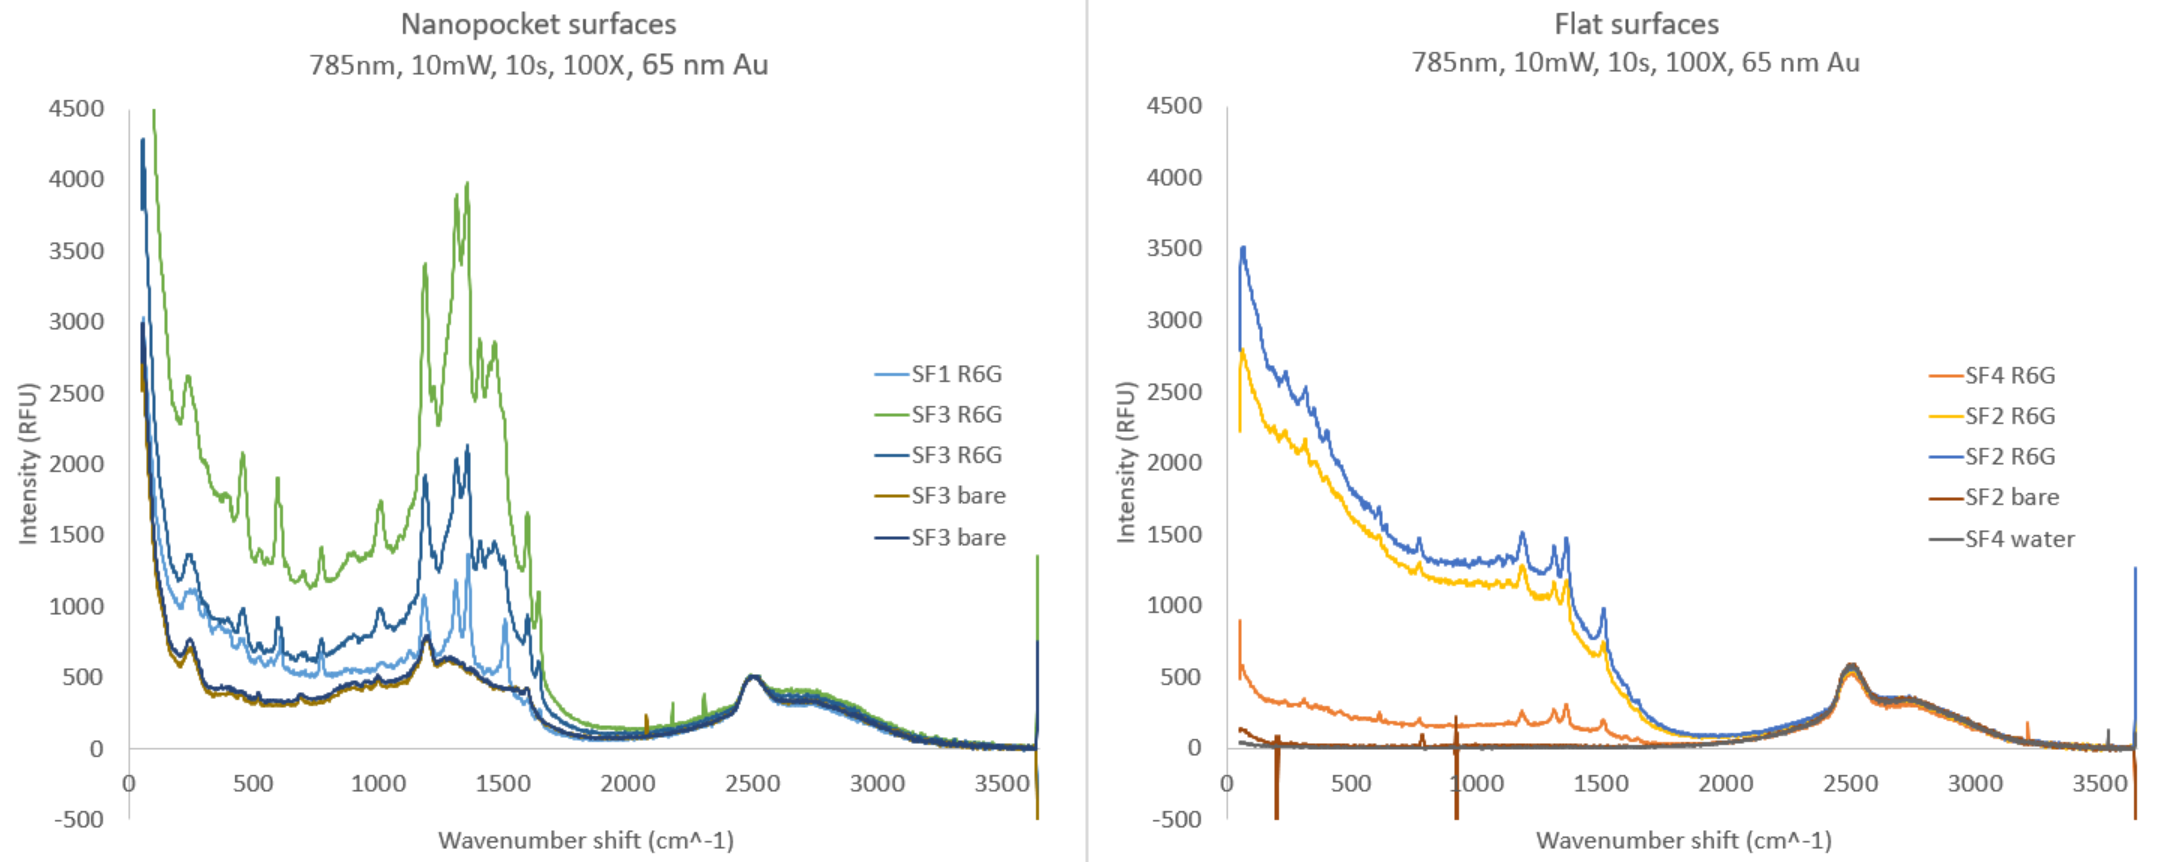
Figure 18. Average rhodamine 6G signal on various surfaces. Higest signal is produced from the SF3 surface. The SF3 surface also has a much larger background than then other surfaces
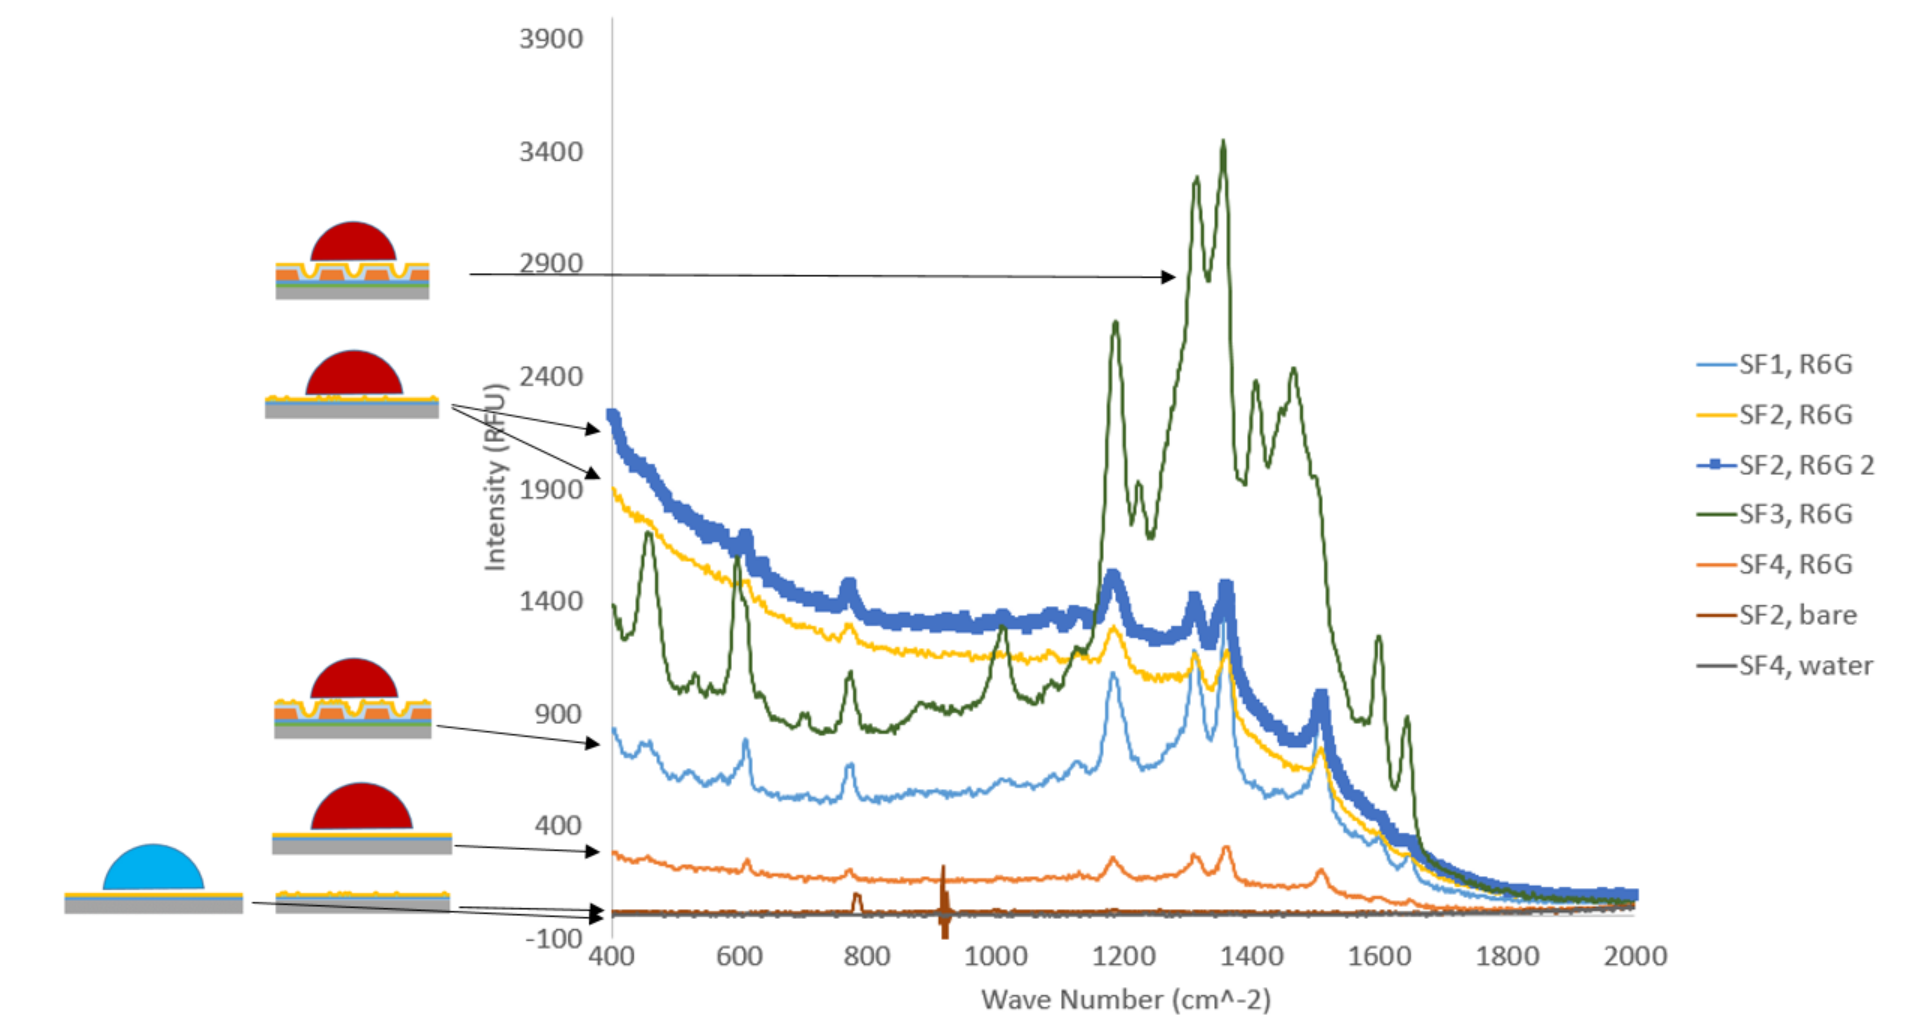
Figure 19. Raman signal intensity vs. the surfaces of interest. The peak intensity for the nanopocket surface was larger than the non-patterned metallized surface. Interestingly the bumpy surfaces were lower in intensity than their respective plain surfaces.
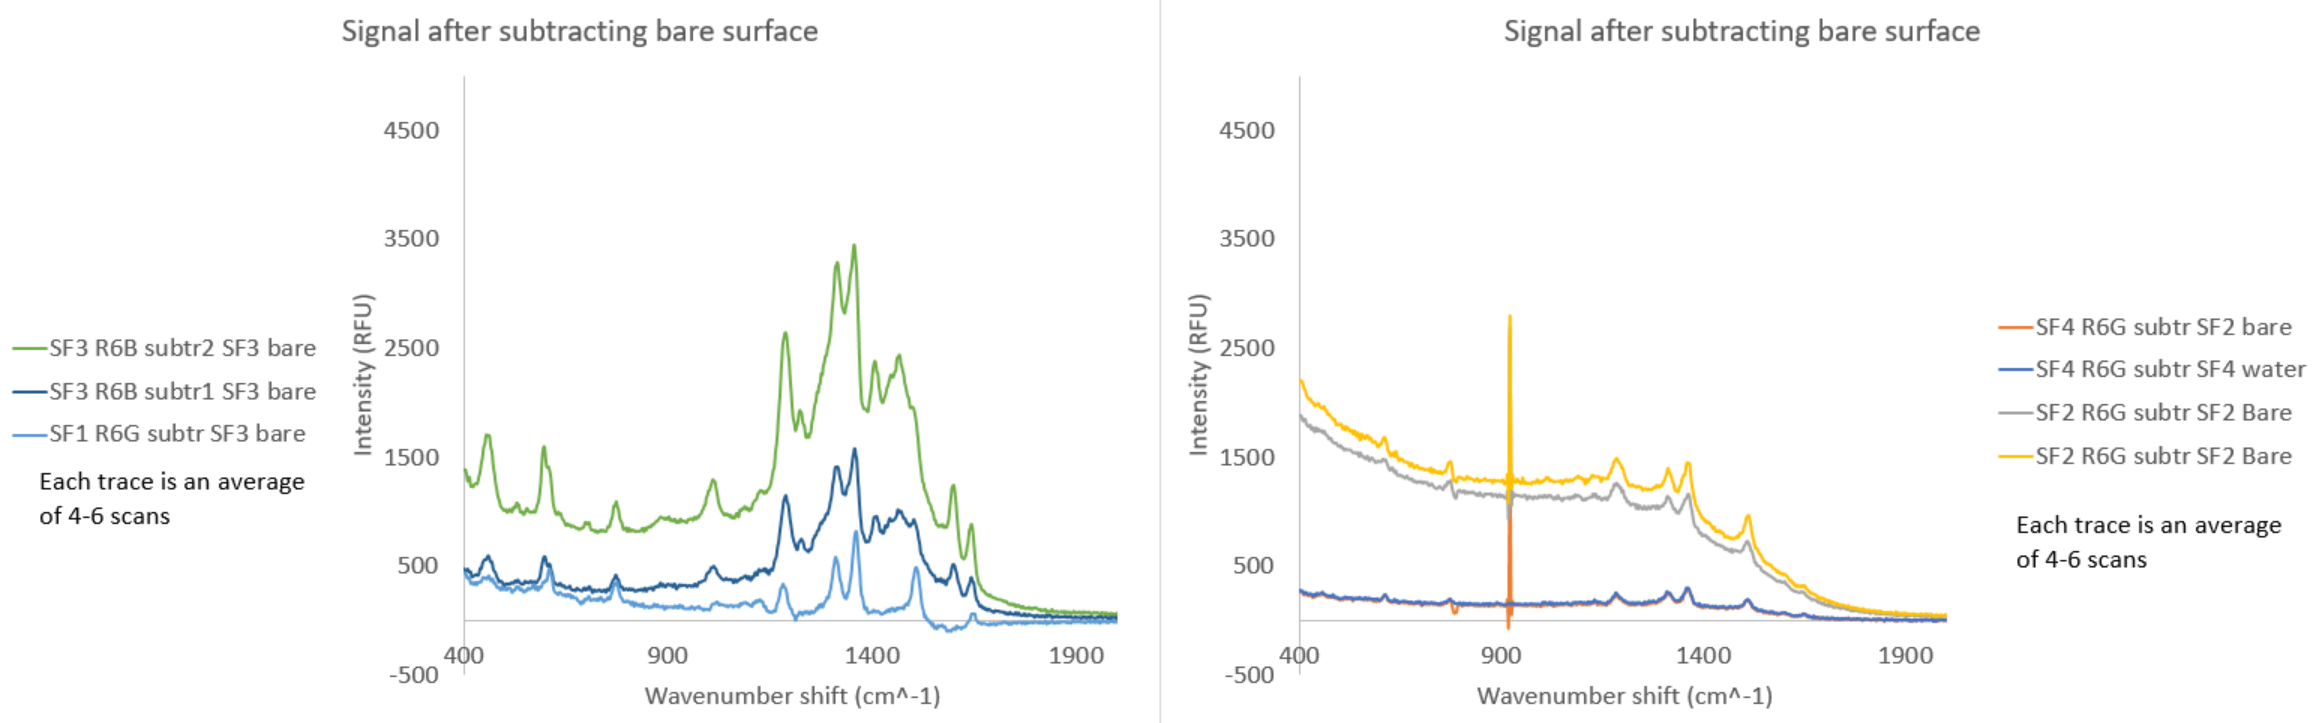
Figure 20. Surface subtracted Raman intensity for each surface type with nanopocket surfaces on the left and the non-patterned surfaces on the right. These are surface subtracted signals but not background subtracted signals. The signal amplification is much larger for nanopockets than for non-patterned surfaces.
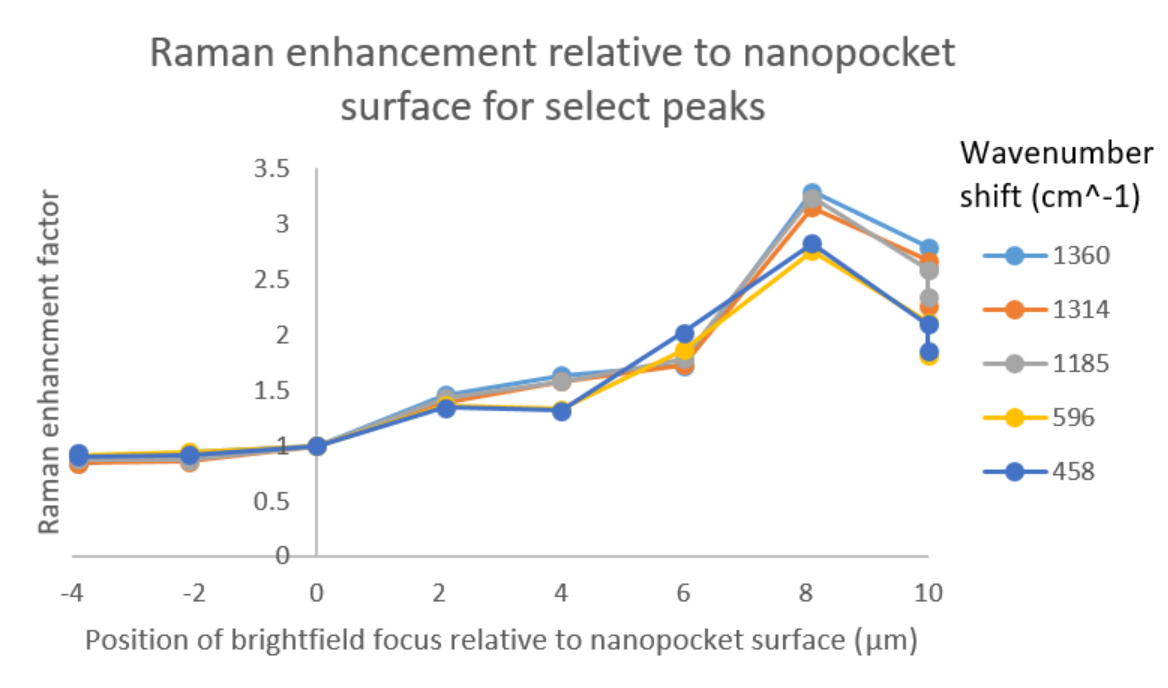
Figure 21. The position of the bright field focus of a single spot affects the Raman intensity by a factor of ~3 with the highest enhancement at about 8 µm above the surface.
Summary
- Raman measurements using nanopocket membranes are getting closer to actual use
- Method of making wafer-level free-standing membranes
- Raman signals acquired
- Coffee-ring effect is both problematic due to non-uniformity and helpful because it concentrates sample
- Small molecule Rhodamine 6G measurements are more reproducible than VLDL or EV measurements
- Depth of focus affects the measurement