Pump-assisted oscillation mixing in μSIM for consistent small volume sampling and measurement from bottom channel.
- Background
From previous experimental results as well as COMSOL simulations presented in our older posts, we observed a universal non-uniform analyte distribution in the μSIM bottom channel due to limited lateral diffusion rate. This uneven distribution profile will limit our sensitivity in using small volumes of supernatants collected from the ports which are far away from the source (cell membrane) to characterize and differentiate protein secretion profiles between conditions. Additionally, manual small volume sampling involving the use of pipettes would inevitability induce flows during tip insertion, liquid extraction, and tip removal, causing variations between devices and experiments. Therefore, it would be ideal for the bottom channel to be homogenized prior to these small volume samplings to eliminate these errors. Here, we utilize an external multichannel peristaltic pump to perform this pre-sampling mixing using programmed oscillating flows to obtain consistent small volume sampling results when using the same experimental parameters.
- Experiments, Results and Discussions
From our COMSOL simulations, we observed that a symmetrical oscillating laminar flow (1ul/s flow rate with 5ul of amplitude) within the uSIM geometry can sufficiently homogenize the initially uneven concentration profile. (Fig. 1.) This promising result eliminates the need of redesigning and adding complex vortex-forming microstructures to promote mixing common in a lot of microfluidic applications.
Fig. 1. Concentration profile during oscillating laminar flow mixing
To increase the mixing throughput as well as preventing manual mixing errors, we use a programable 8 channel low speed peristaltic pump to induce this flow. The pump communicates with a laptop through a RS232 serial port and program commands are written in MATLAB. We first calibrated the flowrate to ensure accurate and uniform flowrates across all 8 channels of the pump. Then, we use a double-sided adhesive and a needle(0.25”OD, 0.17”ID, 0.5”L)as an interface between the uSIM ports and the peristaltic pump’s flexible tubing. The adhesive allows repeated sealing of the inserted needle which enables the device to be mixed every time prior to the multiple sequential samplings. We then perform a simple test using food dye introduced to just one port to visualize the mixing efficiency using the setup.(Fig. 2.) During the mixing, the tubes from the peristaltic pump are empty to prevent further dilution of the bottom channel and therefore the fluidic movements are driven by atmospheric pressure and air movements in the tubing. A short clip is shown here to visualize the mixing process where the blue food dye appeared uniformly distributed after 10 cycles. (Video. 1)
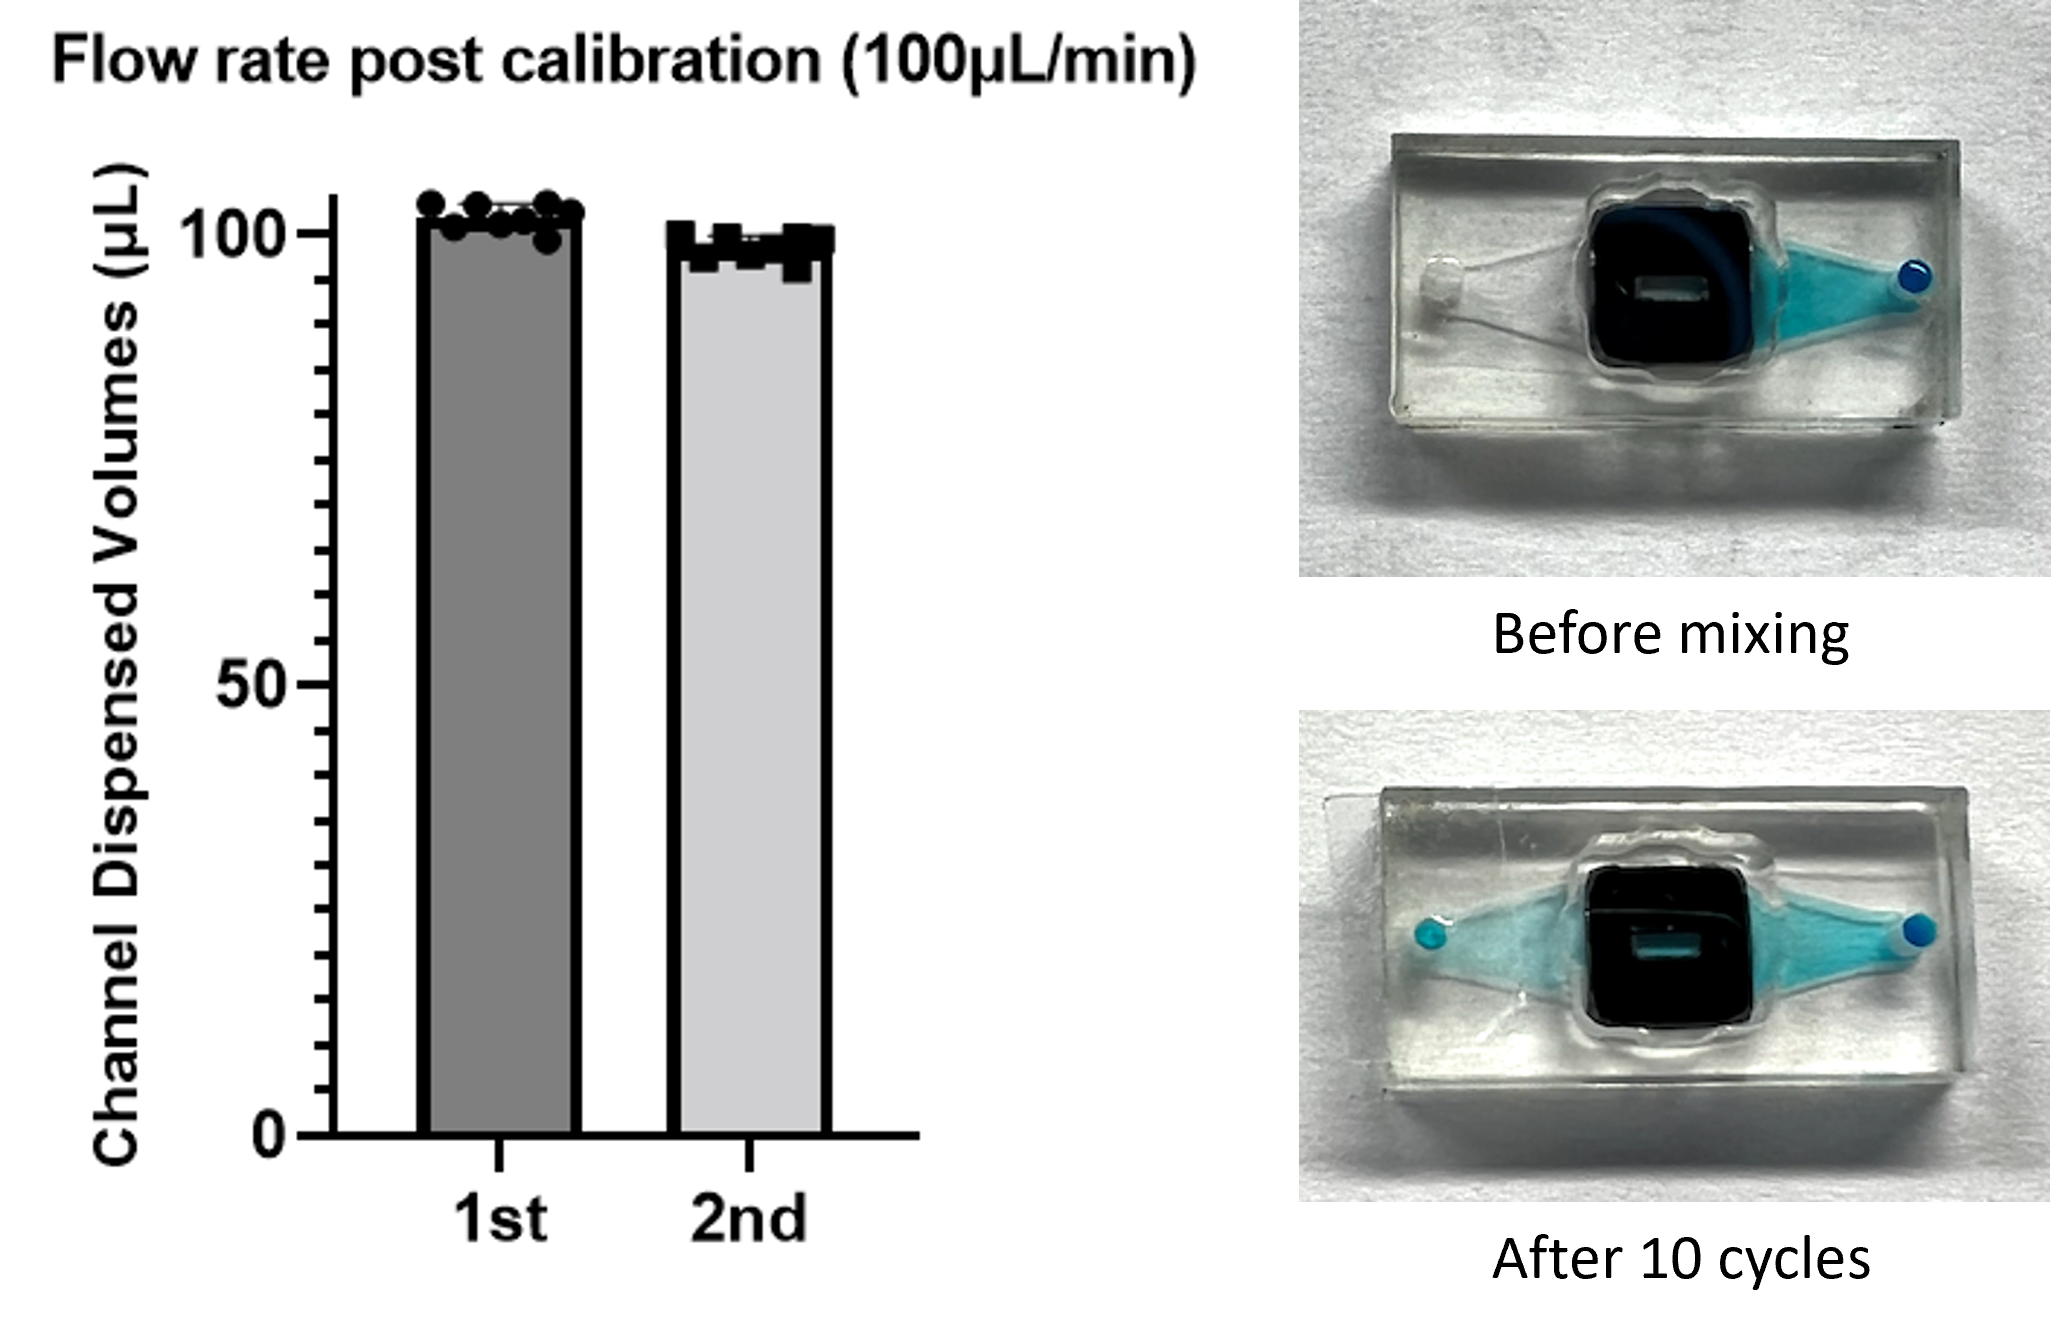
Fig. 2. Flow rate accuracy and uniformity characterization and food dye experiments to visualize convection induced mixing efficiency.
Video 1. Fluidic movements during the mixing process.
Next, to mimic the symmetric analyte distribution profile in permeability/secretion assays and provide a quantitative metric of this mixing performance. We used Fluorescein isothiocyanate (FITC, molecular weight 389.4) as the analyte and put a high concentration (1mg/ml) in the top uSIM reservoir and PBS in the bottom channel then allow it to diffuse across the membrane then laterally to the ports. We allow 40 minutes of this diffusion process based on fluorescent microscope imaging to make sure there is a measurable level of fluorescent molecules close to the port.
4 uSIM devices were given the same conditions and incubated as described. (Fig 3A) 2ul of manual sampling was done on all 4 devices after the incubation to represent the no-mix procedure we were using. Then, all devices were connected to the pump and mixed by the oscillating flow for 20 cycles with a flow rate of 1.5ul/s and 2.25ul of amplitude (Fig. 3A) 2ul was again extracted from all devices to represent the small volume sampling after mixing. Lastly, the total bottom channel volume was extracted. We used a plate reader to characterize the FITC concentrations of the collected samples. The calibration curve of the fluorescent concentration vs. the intensity is shown in Figure 3B and the measured concentrations of all collected samples were shown in Fig 3C. From the results in Fig 3C, we observed that the no-mix method gives a coefficient of variance (CV) of ~50% and an extremely low FITC concentration due to limited lateral diffusion and errors during the manual sampling. Whereas the mixed group yielded a mere 1.8% CV and a ~100-fold increase in FITC concentration as compared to the no-mix group. The concentrations measured from the total extractions were similar to the mixed group and was slightly higher possibly because the top reservoir liquid wasn’t removed prior to the full extraction and some fluid may have crossed the membrane during the full extraction process. (CV=15.3%, one membrane broke during the full extraction so only 3 data points were available)

Fig. 3. A) 4 device incubation of FITC and parallel mixing setup using the programable pump B) calibration curve of the fluorescent concentrations and their correlating intensities C) measured concentrations of the collected samples using different sampling methods, The “Mix (2ul)” group as proposed is desirable
- Conclusion
In conclusion, we have developed and verified both qualitatively and quantitatively that the pump-controlled oscillation mixing is reliable to increase signal to noise ratio as well as lowering the device-to-device CV from the manual small volume sampling process. The mixing flowrate and number of cycles can be easily tuned to prevent membrane disruption while maintaining mixing performance. The resealable interface is also suitable for us to perform this mixing procedure repeatedly prior to all our sampling steps at different time points. This mixing method should be valid and applicable to all future experiments when the uniformity of the bottom channel is desired, and the multichannel peristaltic pump may be replaced with a more affordable pressure pump with a one to multiple port adaptor.
Thanks, Howard, that’s cool. Two things:
1) I see the flow rate (1.5ul/s), but can you capture the following within the post: Either (or both) of the cycle time and/or “stroke volume” (how much volume moves back and forth with each cycle). And also the total volume of the lower channel? In general, I’m wondering what fraction of the total volume you’re moving back and forth – and at what frequency.
2) You mentioned that the boundary conditions seems a little weird. In particular at about 20 sec, the simulation seems to “ingest” high concentration from the inlet port at the left … and that high concentration does make it into the main channel, still separated from the area of high concentration that seemed to come from the membrane. Perhaps long tubes at both inlets would allow you to provide enough space for mixing while setting the b.cc to 0 concentration.
Thanks, Steven Day
Thanks Steven you are right, and I actually missed to include that in the post. I did some simulation on different flowrates but on the same stroke volume and they don’t have an apparent difference. Therefore, the stroke volume is more crucial in this kind of mixing. The stroke volume(amplitude) I used for simulation is 5ul (5s on 1ul/s flowrate) and 2.25ul (1.5s on 1.5ul/s flowrate) for my experiments. The total volume in the bottom channel including the ports is ~12ul. I will include this information in the post as well. Thanks for the simulation advice! That makes sense, and I will try it.
Don’t forget to add the details on the needles and tape. Some folks around here would start using this trick right away instead of existing methods.
And the shear all along the trench. No hurry on that, but before your mixing is applied to a co-culture, we will need to know. Perhaps I’ll have a rotation student do Britta’s experiment: shear on pericytes and report back.