Effect of Tau on BMEC Monocultures in μSiMs (Rotation Project – Emily Reitz)
Introduction
Alzheimer’s disease (AD) is a neurodegenerative disorder that is characterized by accumulation of amyloid beta (Aβ) peptides and neurofibrillary tangles (NFTs) made of aggregates of the protein tau (1,2). It results in the destruction of neurons and their connections due to this accumulation of amyloid beta and tau (3). Tau is a microtubule associated protein that plays a role in maintaining assembly and stability of microtubules in physiological conditions (1). However, in AD, tau becomes hyperphosphorylated and detaches from microtubules, resulting in destabilization of the microtubule cytoskeleton (2). In the hypothesized mechanism of microtubule destabilization, tau is released extracellularly and spreads to other neurons which causes native tau phosphorylation, misfolding, and aggregation, in turn leading to microtubule destabilization (2). It has also been shown that tau oligomers can collect in the brain microvasculature in neurodegenerative diseases such as AD. This accumulation of oligomeric tau therefore may play a role in cerebrovascular dysfunction which is one of the early causes of AD. It is likely that the tau released extracellularly from neurons can travel to the microvessels and result in tau passing through the blood-brain barrier (BBB) formed by endothelial cells (2). Hussong et al. showed that pathogenic tau oligomers accumulated in the brain microvascular endothelial cells of P301S mice, resulting in AD-like brain microvascular deficiencies (2). The goal of this rotation project was to replicate the study done by Hussong et al. by adding monomeric tau to brain microvascular endothelial cell-like cells (BMECs) cultured on the top side of the silicon membrane microdevices (μSiMs) to induce the morphological changes found in AD, particularly microtubule destabilization.
An additional aspect that I evaluated during this rotation was the effect of poly-l-lysine on co-cultures of brain pericyte-like cells (BPLCs) and BMECs. Poly-l-lysine is a polymer that is meant to promote adhesion of cells to a substrate (4). The purpose of the poly-l-lysine was to prevent BPLCs from attaching to the walls and bottom of the channel while ensuring they adhere to the bottom side of the membrane. The goal was to assess the effect of poly-l-lysine on the BPLC-BMEC co-culture when it was coated on the bottom side of the μSiM membrane.
Methods
Poly-l-lysine Experiment
The μSiM devices were built using the nanoporous membrane. Prior to assembly, the trench side of the membrane was coated with a 50 μL droplet of 2 μg/cm2 of poly-l-lysine diluted in PBS. The coating was allowed to sit for 2 hours at 37°C. After 2 hours, the poly-l-lysine droplet was removed, and the membrane was washed with 50 uL of ultrapure water. The devices were then assembled as normal with the trench side being the bottom well. On the day of seeding, the top well of the device was coated with 4:1:5 ratio of collagen IV/fibronectin/water and the bottom channel of devices without poly-l-lysine were coated with 80% collagen IV and 20% water. Brain pericyte-like cells (BPLCs) were seeded on the bottom side of the μSiM at a density of 14,000 cells/device and were allowed to adhere for 2 hours. After 2 hours they were flipped and allowed to grow overnight. The next day, BMECs were seeded at a density of 15,000 cells/device on the top side of the μSiM to create a co-culture. The devices were monitored over the course of 6 days after seeding with BMECs. They were then fixed with 4% paraformaldehyde and blocked with 10% goat serum. All devices were incubated with primary antibodies for VE-cadherin (endothelial cell marker) and PDGFRβ (pericyte cell marker) and 0.001 mg/mL Hoechst nuclear stain. Images were taken on the Dragonfly Spinning Disc Confocal and analyzed in the Imaris Viewer.
Tau Experiment
The μSiM devices were built with the trench side facing down. For this portion of the experiment, monocultures with BMECs only as well as BPLCs only were created. Additionally, several co-culture devices with BPLCs seeded on the bottom well and BMECs seeded on the top well were created. The coating solution of 4:1:5 collagen IV/fibronectin/water for the top well and 80% collagen IV and 20% water for the bottom well was used on the devices prior to seeding. The cultures were permitted to grow for 4 days after seeding of the BMECs at a density of 15,000 cells/device. On the 4th day, 40 μg/mL of monomeric tau protein diluted in hECSR medium was added to both the top and bottom wells of half the devices. The other half of the devices were used as a control. Prior to adding tau to the devices, phase contrast images were taken of the devices. Monomeric tau was added to the devices because tau should naturally oligomerize when exposed to 37°C which will create the oligomeric tau of interest. To avoid evaporation of medium in the top well and prevent diluting the concentration of tau by adding more medium after one day, 140 μL of the 40 μg/mL tau solution was added to the top well of each device as opposed to the typical 100 μL. The same volume was added to the control devices without tau as well. The devices were then incubated at 37°C for approximately 42 hours with tau. The concentration of tau added to the devices as well as the length of time for tau to be added to the culture was adapted from Hussong et al. (2).
The following ICC procedure was adapted from Hussong et al. (2). All of the following solutions were added to both the top and bottom well of every device. After 42 hours of incubation with tau, the devices were washed twice with PBS then fixed with 4% paraformaldehyde for 20 minutes. They were then permeabilized with 0.1% Triton X-100 diluted in PBS for 15 minutes and blocked with 10% goat serum for 1 hour. All devices were incubated with primary antibody β-tubulin and CD31 at 4°C overnight. The next day, primary antibody was removed, and devices were washed three times with PBS. The devices were then incubated with secondary antibodies goat anti-rabbit IgG Alexa Fluor 568 and goat anti-mouse IgG Alexa Fluor 488 for 1 hour at room temperature. The secondary antibodies were removed, and devices were washed three times with PBS. After washing, 0.001 mg/mL Hoechst was added to each device for a nuclear stain. After 3 minutes of incubation with Hoechst, it was removed and replaced with PBS for imaging. Imaging was done on the Dragonfly Spinning Disc Confocal and analyzed in the Imaris Viewer.
Results
Poly-l-lysine Experiment
Below are phase contrast images of BPLC-BMEC cocultures on Day 5 after seeding.
a)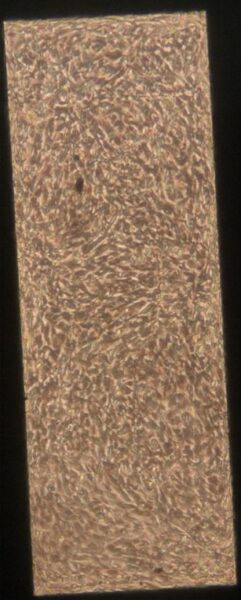 b)
b) c)
c) 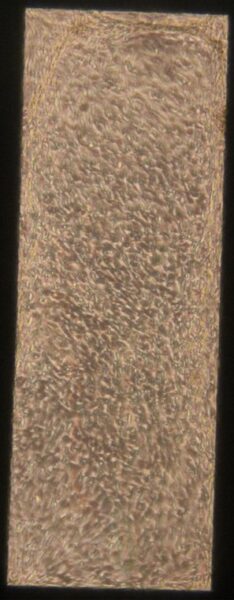 d)
d)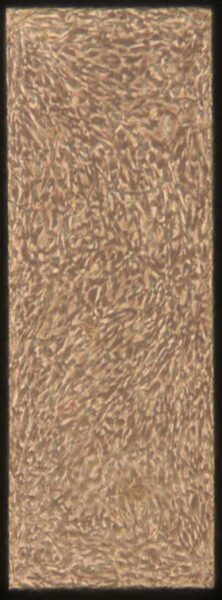
Figure 1: Phase contrast images of BPLC-BMEC cocultures 5 days after BMEC seeding. The bottom channel of the devices was coated with col IV/water.
a)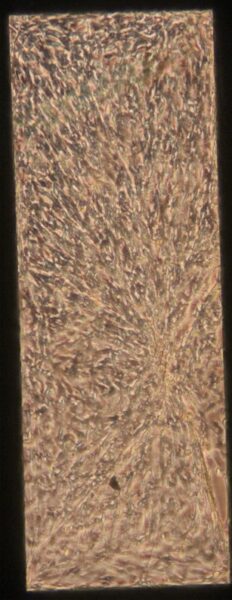 b)
b) c)
c) d)
d)
Figure 2: Phase contrast images of BPLC-BMEC cocultures 5 days after BMEC seeding. The bottom channel of the devices was coated with poly-l-lysine.
In Figure 1, there is an even monolayer across the membrane in all of the images. There does not appear to be any gaps in the layer. In contrast, in Figure 2b-d there are clear gaps in the layer. It is possible that the poly-l-lysine is having a negative effect on the BPLCs and BMECs and causing them to pull back and prevent the even monolayer from forming. Since all of the collagen IV/water coated devices showed even monolayers, it appears that this coating method is superior to the poly-l-lysine coating.
After 6 days of culture, the devices were fixed and stained. This was done so I could practice the fixing and staining process. Below are images from a poly-l-lysine coated device stained for VE-cadherin, PDGFRβ, and Hoechst taken on the Dragonfly Spinning Disc Confocal. VE-cadherin is shown in green, PDGFRβ is shown in yellow, and the nuclear stain is in blue.
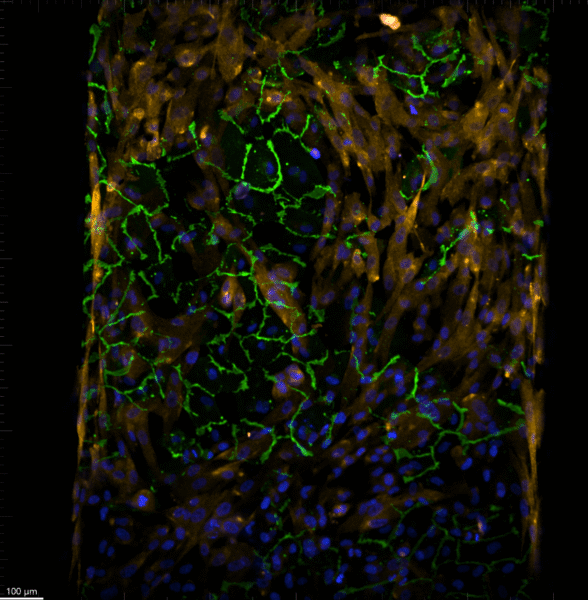
Figure 3: 10x confocal image of poly-l-lysine coated device stained for VE-cadherin, PDGFRβ, and Hoechst.
Figure 4: Video showing pan across xy plane from the bottom up on 40x objective for poly-l-lysine coated device.
Figure 5: Video showing pan across xz plane on 40x objective for poly-l-lysine coated device.
It is clear from both the 10x image shown in Figure 3 and the 40x videos in Figures 4 and 5 that there was not a flat layer of cells, and the membrane was curved. You can see from the green VE-cadherin stain that is not evenly spread across the single slice shown in Figure 3. In addition, as the z stack increases, you can see a slope of green stain (VE-cadherin), further showing this curved look.
The following images are from a collagen IV/water coated device.
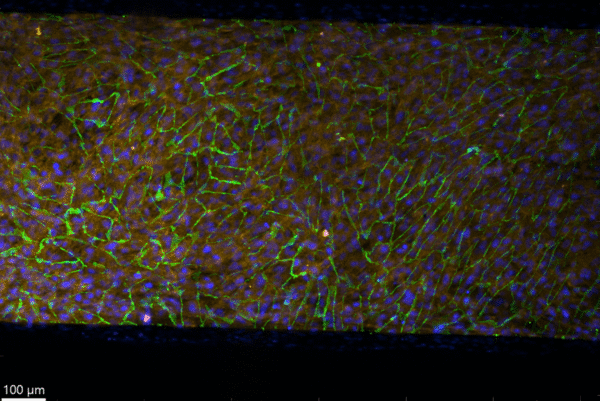
Figure 6: 10x confocal image of collagen IV/water coated device stained for VE-cadherin, PDGFRβ, and Hoechst.
Figure 7: Video showing pan across xy plane from the bottom up on 40x objective for col IV/water coated device.
Figure 8: Video showing pan across xz plane on 40x objective for col IV/water coated device.
As shown in both Figure 6 and the videos in Figures 7 and 8, it is clear that in this coculture device the membrane was less curved and there was more of a flat layer. The VE-cadherin in Figure 6 is evenly distributed across the membrane in contrast to Figure 3. When looking at the z stack video from the bottom up, this even distribution of VE-cadherin is clear as well. This shows how the membrane was flatter and the cell layer was more even. This is visible in the xz pan in Figure 8 as well. Overall, fixing, staining, and imaging these devices was for practice and getting used to this process.
Tau Experiment
Prior to adding tau, phase contrast images were taken of all the devices. While there were several cocultures with BPLCs and BMECs as well as monocultures with BPLCs only, the results presented here are only of the monocultures with BMECs only. The BMECs are the cells of interest, and the goal was to first replicate the morphology of endothelial cells presented in the study by Hussong et al. Using BMECs only allows for simplicity of the experiment.
Prior to adding tau to the devices after 4 days of culture, phase contrast images were taken of all devices. These are shown in Figure 9 below.
| Pre-Tau Control Group | a) b) b)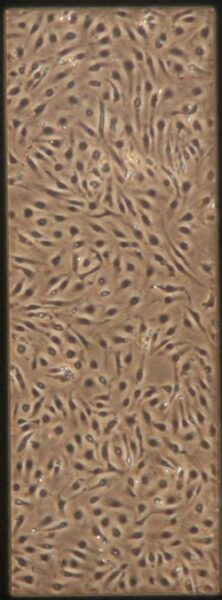 c) c)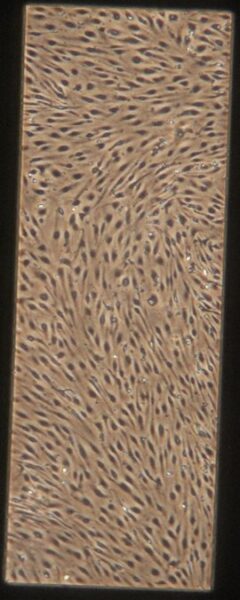 d) d) |
|
| Pre-Tau Experimental Group | e)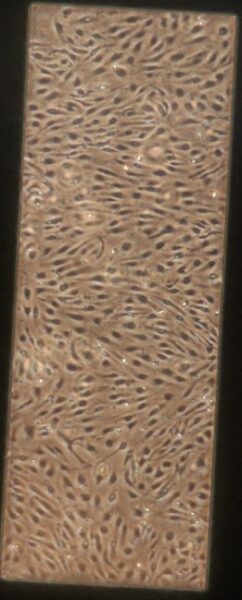 f) f)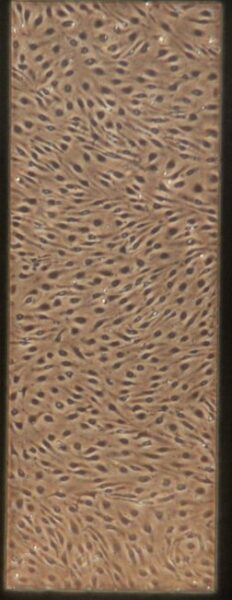 g) g)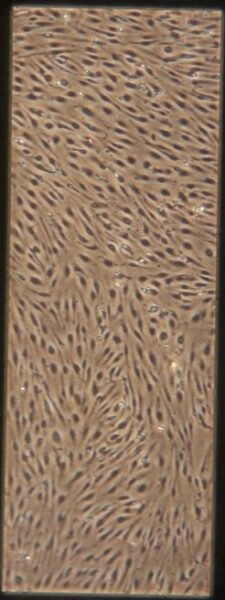 h) h)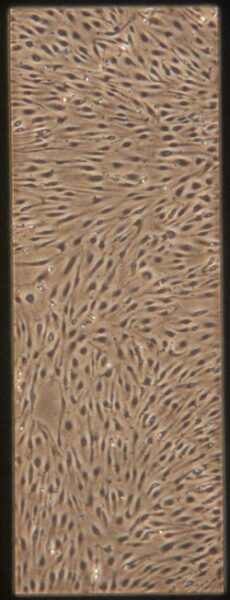 |
|
Figure 9: Phase contrast images of BMEC monocultures on day 4 after seeding prior to adding tau.
After 42 hours of incubating the devices at 37°C with tau, phase contrast images were taken once more, then devices were fixed and stained. Figure 10 shows the phase contrast images 42 hours post-tau.
| -Tau | a)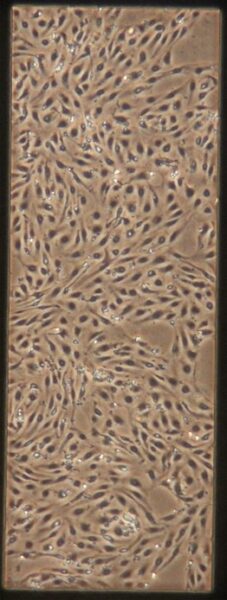 b) b) c) c)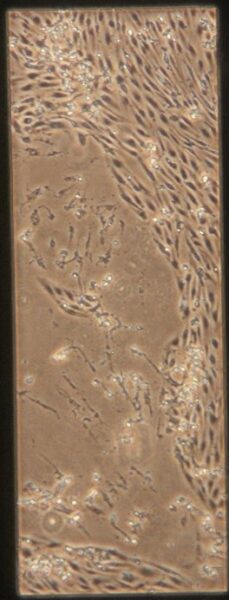 d) d)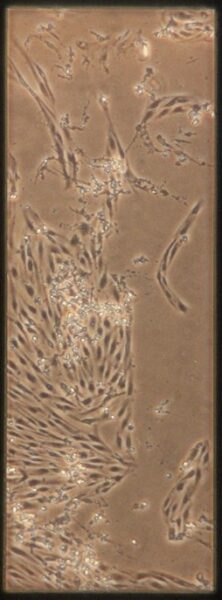 |
| + Tau | e) f) f)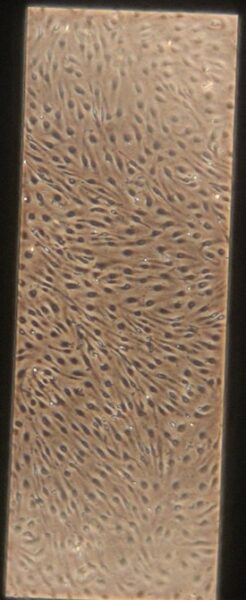 g) g)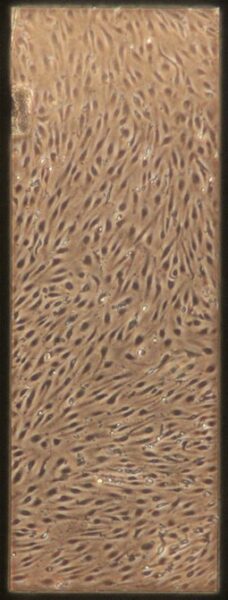 h) h)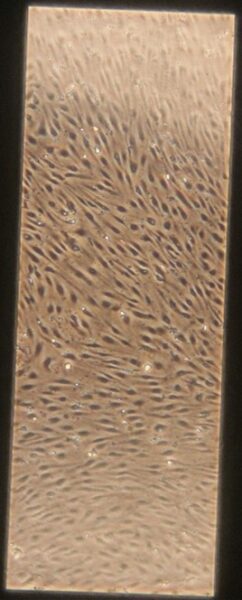 |
Figure 10: Phase contrast images of devices after adding tau. Figures a-d are the control devices without tau, and e-h are the devices with added tau. The letters correspond to the letter labeling in Figure 9.
Something interesting to note is that in Figures 10c and 10d, the monolayer appears to be disrupted. These images are from the control group which is unexpected since they were not treated with anything. Additionally Figures 10a and 10b appear normal. It is unclear what caused this disruption, it could be due to potential issues while pipetting. Devices were then fixed and stained as described earlier. Figures 11 and 12 shows representative confocal image of one of the control devices stained for β-tubulin in green, CD31 in yellow, and Hoechst nuclear stain in blue.
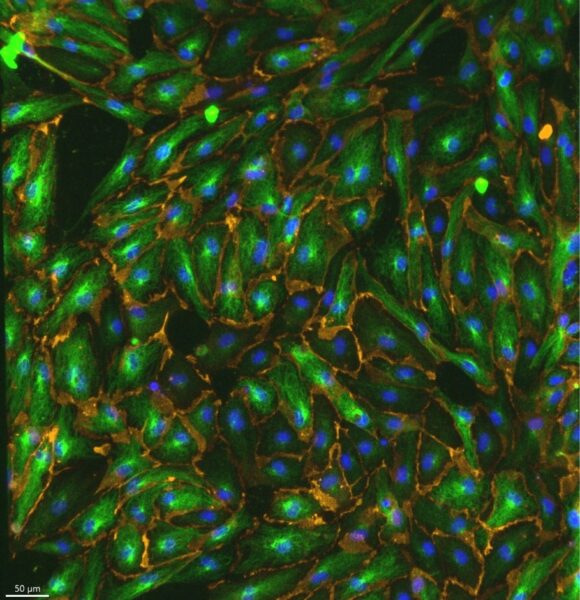
Figure 11: Representative 20x control image stained for β-tubulin in green, CD31 in yellow, and Hoechst in blue.
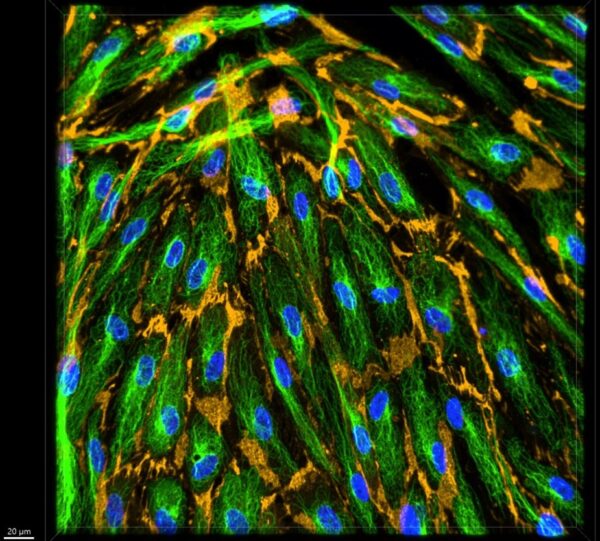
Figure 12: Representative 40x z-stacked control image.
Figure 13: Representative video showing pan across xy plane from the bottom up on 40x objective for control devices.
In Figures 11, 12, and 13 the tubulin staining is very clear. Particulary in Figure 12 you can clearly see the individual microtubules, showing that this staining technique was effective. In the video shown in Figure 13, you can see how microtubule organization changes as the z stack progresses and where they are relative to the nucleus.
Figures 14-16 show representative confocal images for a tau treated device.

Figure 14 Representative 20x image for tau-treated device stained for β-tubulin in green, CD31 in yellow, and Hoechst in blue.
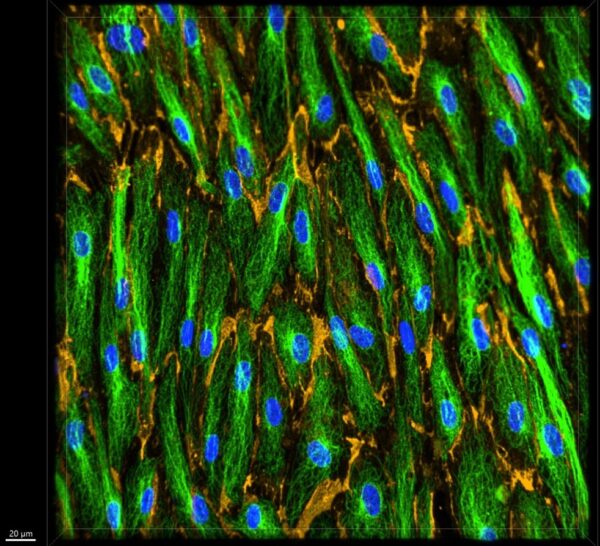
Figure 15: Representative 40x z-stacked image for tau treated device.
Figure 16: Representative video showing pan across xy plane from the bottom up on 40x objective for tau treated devices.
Figures 14-17 showed a similar type of morphology as in the control images (Figures 11-13). The tau treated devices showed the same type of specific tubulin binding which further confirmed that the staining process was effective. When viewing the video in Figure 16, you can see the same type of sloped staining pattern as the z-stack increases that was shown in Figure 4 and Figure 13. This shows how the membrane was once again not completely flat. Figures 14-17 also seem to have a very similar microtubule density as in Figures 11-13. Without any type of quantification, it appears that the monomeric tau did not cause microtubule disruption.
Discussion/Future Directions
When looking at the confocal images visually, it is difficult to tell if there is any true microtubule disruption that is supposed to occur when toxic oligomeric tau is added to the culture. Both the control images and tau images appear to have curly microtubules that generally look similar (Figures 12 and 15). Additionally, as seen in the images and videos, the cell sizes appear heterogenous. This also makes it more difficult to be able to tell if the tubulin was disrupted or not. It is possible that this is the case because the type of tau added to the cultures was monomeric tau, not oligomeric tau. Oligomeric tau typically induces the microtubule disruption present in AD. Based on visual assessment only, adding monomeric tau to the culture and relying on the 37°C temperature conditions to induce neurotoxic oligomerized tau is likely not sufficient to cause disruption of microtubules. Although visually there does not seem to be much difference between the control and +tau group, it is possible that quantifying microtubule density may present different results. In the interest of the deadline for this rotation report to be submitted, quantification of microtubule density has not been done yet. However, this is a future step that I plan to take. I plan to quantify microtubule density using ImageJ.
Going forward, we will attempt to create neurotoxic oligomeric tau to add to the cultures to create the AD morphology in the μSiMs. A study by Ash et al. discusses how tau interacts with RNA and RNA binding protein TIA1 which causes the formation of tau oligomers (5). These tau oligomers that were created during copartitioning with TIA1 were also found to be much more toxic than tau oligomers exposed to just RNA (5). TIA1 is a stress granule nucleating RNA binding protein that has been found to play a role in neurodegeneration in PS19 mice (5). We plan to generate toxic oligomeric tau by using the method described by Ash et al., then add this to the devices to induce AD morphology.
Overall, this rotation allowed me to practice working with the μSiMs, maintain cocultures, and fix and stain devices. I also was able to work with the confocal microscope and learn how to image these devices and effectively present the images. I additionally attempted to get some early-stage data for the tau experiments. Although it appears the first try at mimicking AD morphology was not successful, we plan to keep working through this and trying other methods of creating toxic oligomeric tau as mentioned above. I gained many skills throughout this rotation that will be very useful going forward.
Acknowledgements
I would like to thank Julie Kuebel for showing me how to assemble the μSiM devices and getting me started with seeding and maintaining cocultures. I would also like to thank Michelle Trempel for helping me with a lot of the tau experiments as well as fixing and staining devices. Thank you to Jonathan Flax for support and guidance with the tau experiments. I also want to thank Chloe Chen for helping me with counting and seeding BMECs. Finally, I’d like to thank Jim McGrath for the opportunity to complete this rotation.
References
- Medeiros, R., Baglietto-Vargas, D., & LaFerla, F. M. (2011). The Role of Tau in Alzheimer’s Disease and Related Disorders. CNS Neuroscience & Therapeutics, 17(5), 514–524. https://doi.org/10.1111/j.1755-5949.2010.00177.x
- Hussong, S. A., Banh, A. Q., Van, C. E., Dorigatti, A. O., Hernandez, S. F., Hart, M. J., Ferran, B., Makhlouf, H., Gaczynska, M., Osmulski, P. A., McAllen, S. A., Dineley, K. T., Zoltan Ungvari, Perez, V. I., Kayed, R., & Galvan, V. (2023). Soluble pathogenic tau enters brain vascular endothelial cells and drives cellular senescence and brain microvascular dysfunction in a mouse model of tauopathy. Nature Communications, 14(1). https://doi.org/10.1038/s41467-023-37840-y
- Rawat, P., Sehar U., Jasbir Bisht, J., Selman, A., Culberson, J., & P. Hemachandra Reddy. (2022). Phosphorylated Tau in Alzheimer’s Disease and Other Tauopathies. International Journal of Molecular Sciences, 23(21), 12841–12841. https://doi.org/10.3390/ijms232112841
- Poly-L-Lysine Cell Attachment Protocol. (2016). com. https://doi.org/Dogri
- Ash, P. E. A., Lei, S., Shattuck, J., Boudeau, S., Carlomagno, Y., Medalla, M., Mashimo, B. L., Socorro, G., Louloua F A Al-Mohanna, Jiang, L., Öztürk, M. M., Knobel, M., Ivanov, P., Petrucelli, L., Wegmann, S., Kanaan, N. M., & Wolozin, B. (2021). TIA1 potentiates tau phase separation and promotes generation of toxic oligomeric tau. Proceedings of the National Academy of Sciences of the United States of America, 118(9). https://doi.org/10.1073/pnas.2014188118