EOF&DEP simulations for 300 nm membranes
We have considered SiN membranes in PDMS channels as EOF pumps and as constrictions for insulator-based dielectrophoresis (iDEP). For EOF, thicker membranes may yield greater flow rates. For iDEP, a smaller membrane porosity, meaning fewer, smaller holes on a given membrane area, are likely to result in more effective iDEP trapping of particles.
I built a simple finite element analysis model in COMSOL for the following setup:
- 62.4 um x 62.4 um x 0.3 um membrane
- 2 um channel length on either side of the membrane
- 3 um diameter pores in three configurations: Single pore, 6 um pore spacing, 9 um pore spacing. Pores with 6 or 9 um spacing were arranged as shown below:

EOF:
In COMSOL, used the electric currents and laminar flow modules. I used the “electroosmotic slip” boundary condition on the walls. COMSOL calculated electroosmotic slip using the electric field computed by the electric currents module, and zeta potential values that I provided. I used -13 mV for the PDMS surfaces and -50 mV for SiN. I re-ran the simulations with all surfaces having a zeta potential of -13 mV, to demonstrate the effect of the SiN material. I obtained the flow rates by summing the z-component of fluid velocity over the whole outlet surface. The results are summarized below.
| SiN membrane | PDMS membrane | |
| Single pore | 1.8E-12 | 4.6E-13 |
| 9 um spacing | 1.0E-10 | 6.0E-11 |
| 6 um spacing | 2.3E-10 | 2.7E-11 |
Flow rates are in m^3/s. The “SiN membrane” column shows the results with -50 mV zeta potential on SiN membrane. “PDMS membrane” results simulate a case where the membrane and channel are the same material. They were calculated to verify that the membrane material has a significant impact, and therefore the SiN membrane does play a role as an EOF pump.
The next step is to repeat these simulations for a 30 nm membrane, to determine the effect of membrane thickness.
iDEP:
To predict how pore spacing would affect iDEP behavior, I calculated the gradient of the electric field squared (“gradE2” from now on) for the three pore configurations. Other factors such as particle size and properties being equal, gradE2 is directly proportional to the DEP force acting on a particle. To get a better color scale, I plotted log10(gradE2) instead of gradE2, so a difference of 1 in the plots below indicate an order of magnitude difference. The figures are surface plots showing log10(gradE2) values on the inlet-side surfaces of the SiN membrane.
Single pore:

![]()
9 um pore spacing:
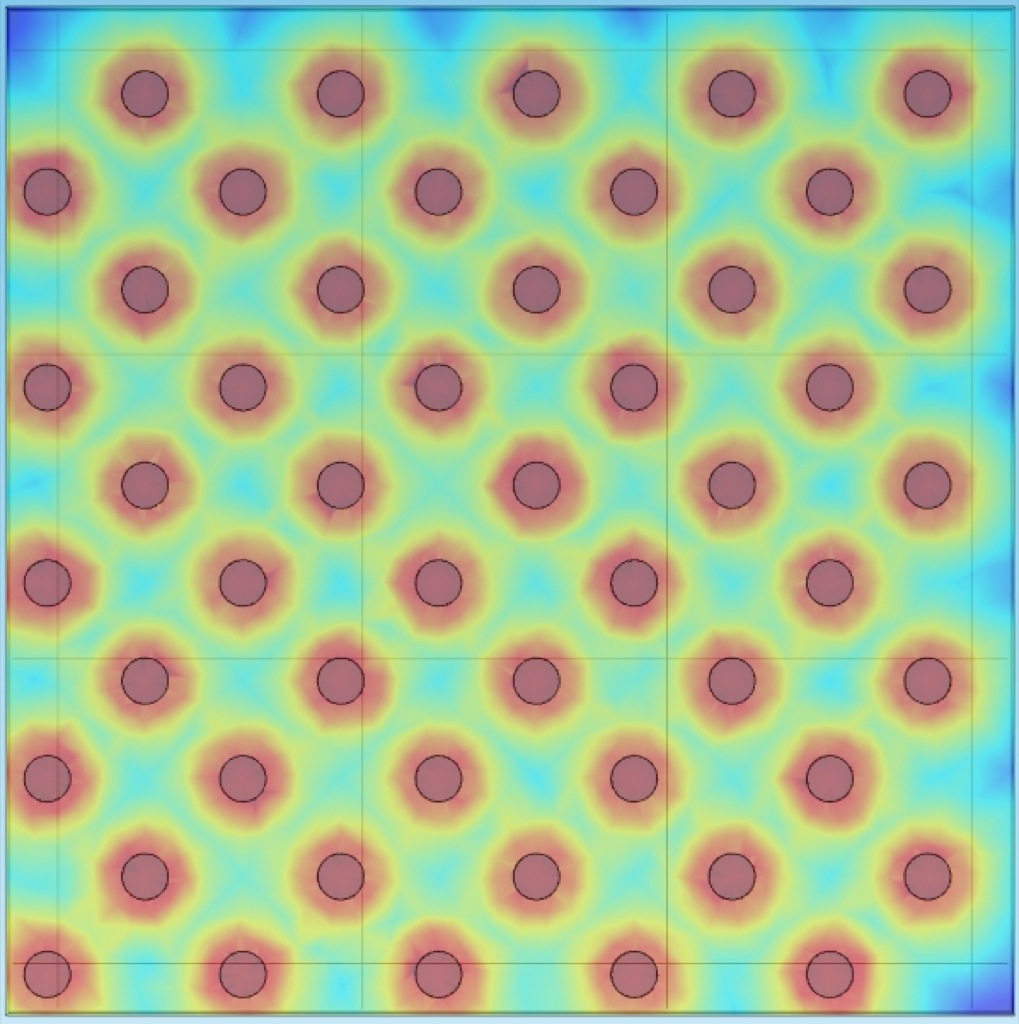
![]()
6 um pore spacing:
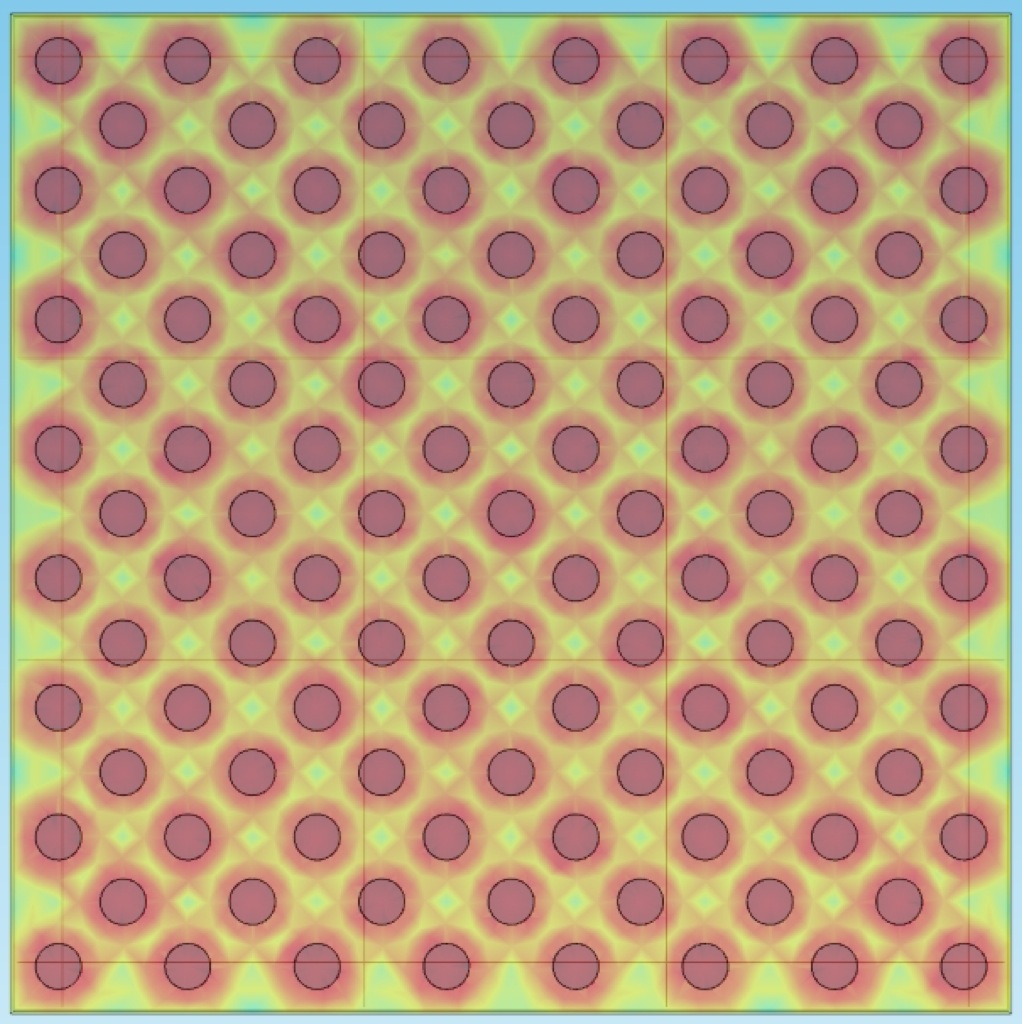
![]()
It was expected that fewer pores, with larger spacing between them, would result in greater gradE2 values. However, the single pore has drastically lower gradE2 values compared to the arrays, and pores with 9 um spacing have lower gradE2 values than those with 6 um spacing, although 9 um spacing has a lower porosity. This could be because electric field lines do not reach the SiN surface a certain distance away from the pores. This is demonstrated by the single pore case: The minimum value for log10(gradE2) is -11, while the minimum log10(gradE2) is 13 for the 9 um spacing case. In this case, an effective pore spacing may be one where there is some overlap between the electric field line constrictions caused by consecutive pores. Also, a comparison some distance ahead of the membrane should be made, which could present a different picture.