Diffusion of Apobec 3G through a pnc-Si array
I recently began working directly with Dr. Harold Smith’s A3G protein. In my previous posts, I worked with BSA and IgG in order to develop a small-scale diffusion set-up able to reach equilibrium before it dries out. These preliminary steps were working towards my ultimate design for a quick and accurate diffusion set-up for A3G.
A3G is readily broken apart by RNase, an enzyme found on virtually every surface, including bench tops and hands. Before performing these experiments, Barrett and I worked to develop a protocol for establishing an RNase-free experiment environment. Basically, it consists of three sequential washes. First, I use RNase Erase (a spray product designed to break up RNase), then RNase free DI water, followed by RNase free 70% EtoH. I do this sterilization process on any surface that may come in contact with the experiment, i.e. the pipetters, 384 well plate, and bench top. This is important because I want to make sure that the A3G does not break apart before the diffusion experiment.
3/15/10
A3G working stock (diluted from bead): 0.9mg/ml of A3G
Goals:
- Make standard curves for A3G and BSA
- Conduct diffusion tests with A3G
Experimental Set-up:

Note: 1ul drop is a bit small, but 1.5ul and 2ul drops are too big. Next time, try 1.25ul drops on top of the membranes.
Results:
The results from the diffusion tests were indistinguishable from the A3G buffer because the sample was diluted about 30x in diffusing into the basolateral of the well.
3/25/10
Goal:
- Repeat standard curves.
Standard Curves for A3G and BSA, averaged from 3/17 and 3/25:
![]()
Use the standard curves to derive equations to convert absorbance values to concentration values:

3/30/10
Goal:
- Conduct diffusion tests in square SepCons because there is less dilution during diffusion, due to smaller basolateral volumes.
Experimental set-up:

Use the above equations to compute the concentrations of A3G in the SepCon diffusion experiement:
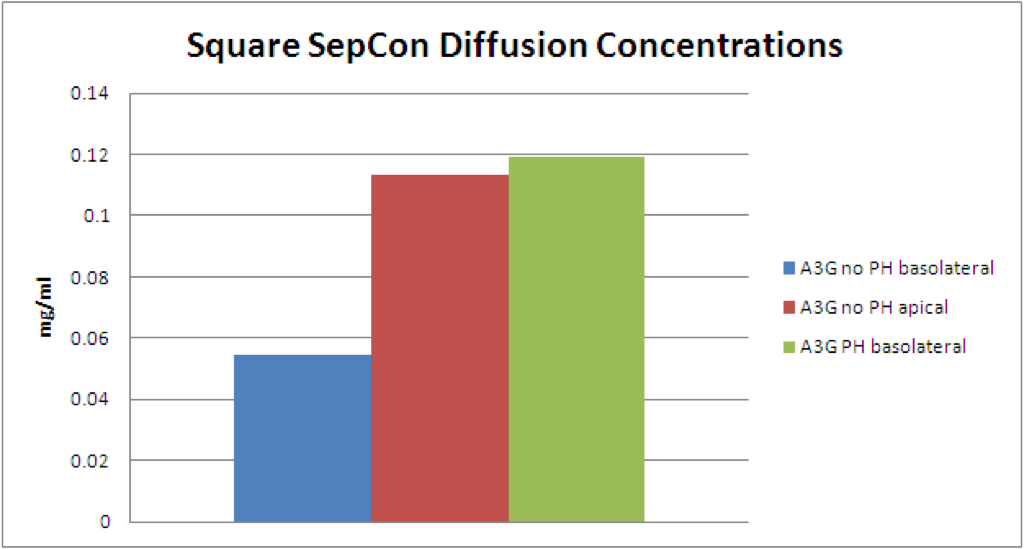
The above graph shows the A3G concentrations, as found from the blanked absorption values. All the values are significantly abouve 0mg/ml (buffer), and so it can be concluded that the A3G is able to pass through the membranes.
DLS data:

From the DLS data, we can see that spinning down the samples effectively cleans up the samples. The larger particles are probably aggregates and the smaller particles at around 20nm are probably A3G (HMM).
Conclusions:
The Bradford assay is not sensitive enough to detect the amount of A3G that diffuses through an array membrane into 30ul of buffer. Possible solutions include partially filling the 396 well plates with PDMS or searching for a more sensitive assay that can detect very low protein concentrations.
The SepCon test shows that A3G can pass through the pnc-Si array membranes.
The DLS test shows that spinning a sample significantly cleans up the sample to arrive at two peaks: one that is HMM aggregates, and the other that is HMM.
What are the conclusions from the SepCon test and DLS studies?