Fabricating Thin Polymer Coatings to Study S. Aureus Durotaxis – Stiffness Measurements
Introduction
The invasion of Staphlyococcus aureus into the cracks of cortical bone leads to osteomyelitis, a devastating disease often resolved by amputation [1]. The μSiM platform has been used to study the genetic mechanisms of S. aureus invasion. The membrane pores mimic the network of cracks in bone, referred to as the osteocyte lacuno-canalicular network [1]. This study by Masters et al. found that the absence of the bacteria’s sensing system did not significantly impact invasion through the membrane pores, indicating that other processes are at play. Therefore we hypothesize that substrate stiffness may impact S. aureus migration, a process known as durotaxis [2]. We aim to explore this idea by coating the membrane in soft polymers (PDMS or PUA).
We hypothesize that S. aureus will not migrate through the PDMS or PUA pores because these materials are too soft when compared to bone, as shown by Young’s moduli in Table 1. Young’s modulus is an elastic measure that refers to the ability of a material to withstand changes in length when compressed. The higher the value, the greater the stiffness.
Table 1. Young’s Moduli
| Material | Theoretical Young’s Modulus |
| Cortical Bone | 18,000 MPa [3] |
| Silicon Nitride Chip | 280,000 MPa [4] |
| PDMS | 0.57 – 3.7 MPa [5] |
| PUA | 11 MPa [6] |
Approach
- Spin coat a 1 μm-thick layer of a soft polymer (PDMS or PUA) on 0.5 μm hole pore chips.
- Etch (via reactive ion etching) through the backside of the chip to create pores in the polymer.
- Chip acts as a shadow mask to allow etching of polymer through chip windows.
- We want an anisotropic etch to achieve uniform pores in the polymer layer.
- Measure polymer stiffness with AFM.
- Analyze layer thickness with SEM.
(Details on the spin and etching process and thickness optimization will be explored in a later post.)
Results: AFM Stiffness Measurements
Force vs. tip separation was measured via AFM for the PDMS and PUA coatings as well as the chip itself. Measurements were taken over the chip window for consistency. Extension/retraction curves are shown in Fig. 1.
The slight dips in the PUA and PDMS retraction curves are due to the tip sticking in the polymer while moving away from the surface.
To prevent this in the future, we will use spherical AFM tips, as this can reduce unwanted tip-sample interactions. A study by Vlassov et al. reported an experimental setup for measuring mechanical properties of PDMS and other elastomers with a spherical probe under controlled load [7]. Another study by Kenry et al. utilized a spherical tip to evaluate the mechanical response of PDMS [8].
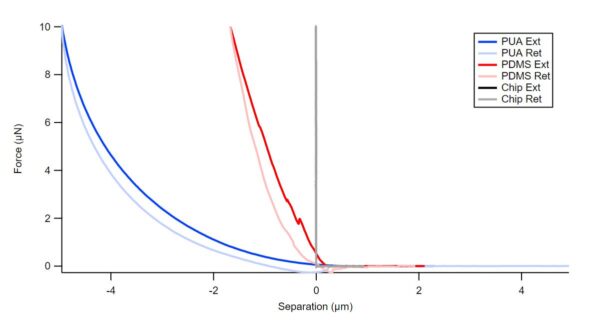
Fig. 1. Force vs. separation data for PDMS, PUA, and chip.
For clarity, Fig. 2. contains an expanded view of the extension/retraction curves for the chip measurements.
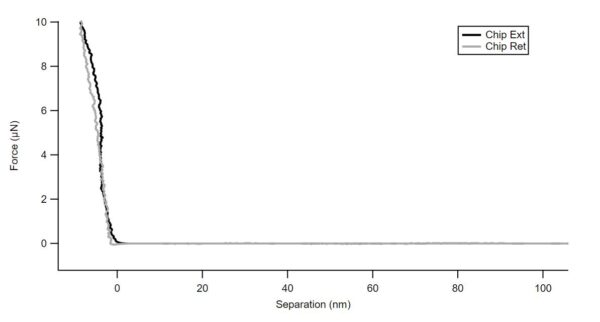
Fig. 2. Force vs. separation data for the chip.
The Young’s moduli of each sample were generated from this data according to the Hertz Model and are summarized in Table 2.
Table 2. Experimental Young’s Moduli
| Material | Experimental Young’s Modulus |
| Chip | 337,000 MPa |
| PDMS | 5.50 MPa |
| PUA | 6.58 MPa |
AFM tip parameters and sample Poisson ratio were used for the Hertz fit. The Hertz model assumes that indentation is neglected in comparison to sample thickness [9]. In addition, the sample should be homogeneous, isotropic, and present a linear elastic response (i.e. stress is proportional to strain).
For a conical tip, the following Hertz equation is applied to calculate the Young’s modulus:
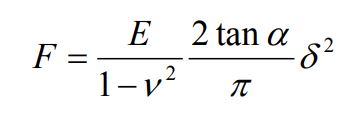
Where E is Young’s modulus, v is sample Poisson ratio, alpha is angle of the tip, and delta is tip separation from surface.
We expected a lower (less stiff) value for PDMS versus PUA, and the Young’s moduli confirm this. However, the curves in Fig. 1. do not correlate with the calculated Young’s moduli. This may be due to inaccuracies of the Hertz fit and using an improper AFM tip. Specifically, the Hertz model assumes absolute elastic behavior, however the energy delivered by the tip is not completely given back by the polymer, appearing as hysteresis between the extension and retraction curves. Moreover, cantilever stiffness and tip shape should be optimized for the sample (cantilever stiffness should be around the range of sample stiffness).
Future Work
- Purchase spherical tips for more accurate stiffness measurements of soft polymers.
- Optimize polymer layer thickness to achieve 1 μm thickness.
References
[1] Masters, E. A.; Salminen, A. T.; Begolo, S.; Luke, E. N.; Barrett, S. C.; Overby, C. T.; Gill, A. L.; de Mesy Bentley, K. L.; Awad, H. A.; Gill, S. R.; Schwarz, E. M.; McGrath, J. L., An in vitro platform for elucidating the molecular genetics of S. aureus invasion of the osteocyte lacuno-canalicular network during chronic osteomyelitis. Nanomedicine 2019, 21, 102039.
[2] DuChez, B. J.; Doyle, A. D.; Dimitriadis, E. K.; Yamada, K. M., Durotaxis by Human Cancer Cells. Biophys J 2019, 116 (4), 670-683.
[3] Seedhom, B. B.; Berry, E.; Ostell, A. E.; Cuppone, M.. The Longitudinal Young’s Modulus of Cortical Bone in the Midshaft of Human Femur and its Correlation with CT Scanning Data. Calcified Tissue International 2004, 74 (3), 302–309.
[4] Sintered Silicon Nitride. AZO Materials, https://www.azom.com/properties.aspx?ArticleID=260.
[5] Wang, Z.; Volinsky, A. A.; Gallant, N. D., Crosslinking effect on polydimethylsiloxane elastic modulus measured by custom-built compression instrument. Journal of Applied Polymer Science 2014, 131 (22).
[6] Li, Jinhai et al. Urethane-acrylate polymers in high-resolution contact printing. Journal of Materials Chemistry. C, Materials for Optical and Electronic Devices, 4(19), 4155–4165 (2016) https://doi.org/10.1039/c6tc01125j
[7] Vlassov, S.; Oras, S.; Antsov, M.; Sosnin, I.; Polyakov, B.; Shutka, A.; Krauchanka, M. Y.; Dorogin, L. M., Adhesion and Mechanical Properties of PDMS-Based Materials Probed with AFM: A Review. REVIEWS ON ADVANCED MATERIALS SCIENCE 2018, 56 (1), 62-78.
[8] Kenry; Leong, M. C.; Nai, M. H.; Cheong, F. C.; Lim, C. T., Viscoelastic Effects of Silicone Gels at the Micro- and Nanoscale. Procedia IUTAM 2015, 12, 20-30.
[9] Determining the elastic modulus of biological samples using atomic force microscopy. JPK Instruments, https://www.jpk.com/app-technotes-img/AFM/pdf/jpk-app-elastic-modulus.14-1.pdf.