Matlab Generated Endothelial Cell Alignment Distribution
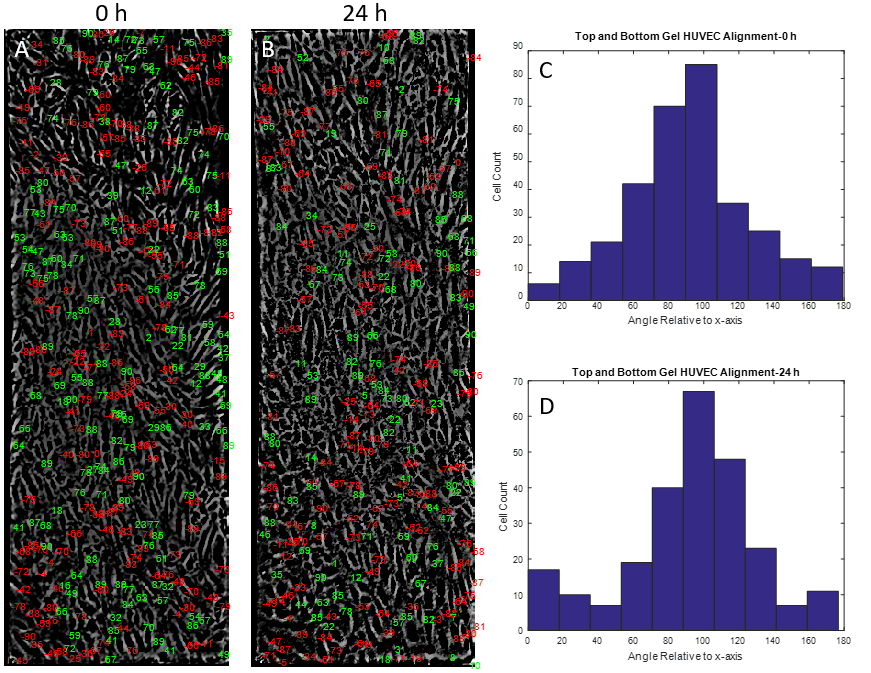
Top and Bottom Gel
Figure 1. Matlab based alignment semi-quantification of HUVECs seeded on top of a collagen I gel. (A) Matlab output of major axis angle (relative to the x-axis) of HUVECs before flow set on top of cell image. (B) HUVEC angle of alignment relative to x-axis after 24 h flow. (C) Histogram plot of A, angles changed to reflect y-axis alignment. (D) Histogram plot of B.
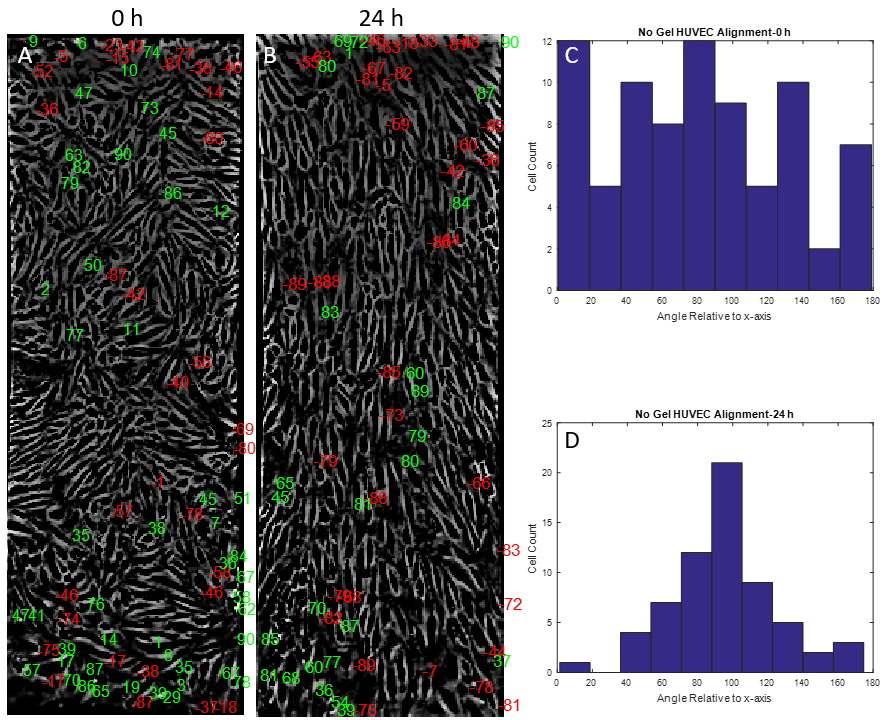
No Gel
Figure 2. Matlab based alignment semi-quantification of HUVECs seeded directly on the NPN chip. (A) Matlab output of major axis angle (relative to the x-axis) of HUVECs before flow set on top of cell image. (B) HUVEC angle of alignment relative to x-axis after 24 h flow. (C) Histogram plot of A, angles changed to reflect y-axis alignment. (D) Histogram plot of B.
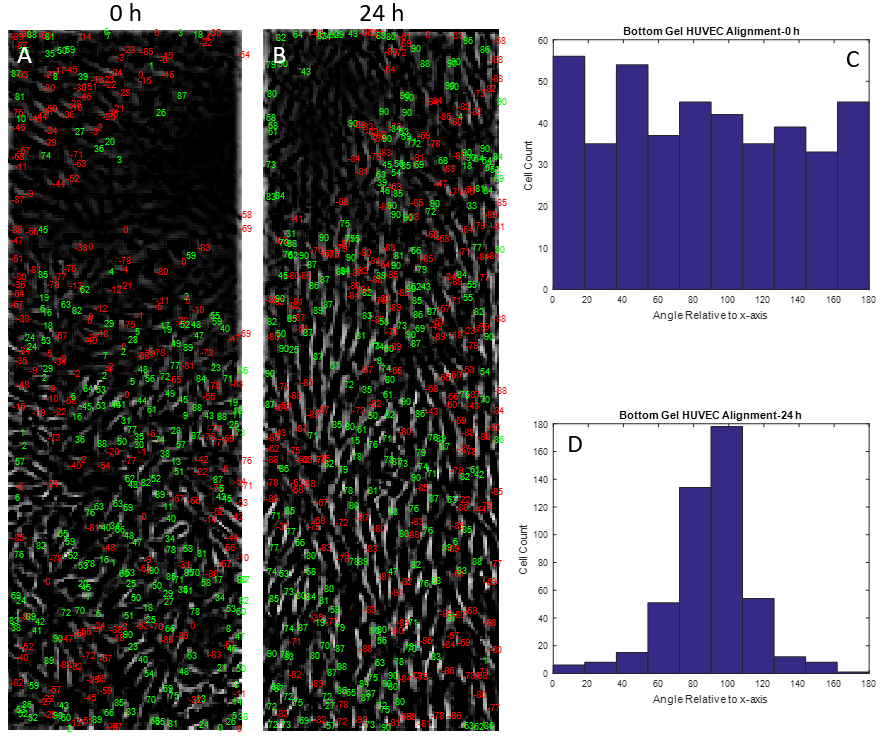
Bottom Gel
Run 1
Figure 3. Matlab based alignment semi-quantification of HUVECs seeded directly on the NPN chip with collagen I gel on the reverse side. (A) Matlab output of major axis angle (relative to the x-axis) of HUVECs before flow set on top of cell image. (B) HUVEC angle of alignment relative to x-axis after 24 h flow. (C) Histogram plot of A, angles changed to reflect y-axis alignment. (D) Histogram plot of B.
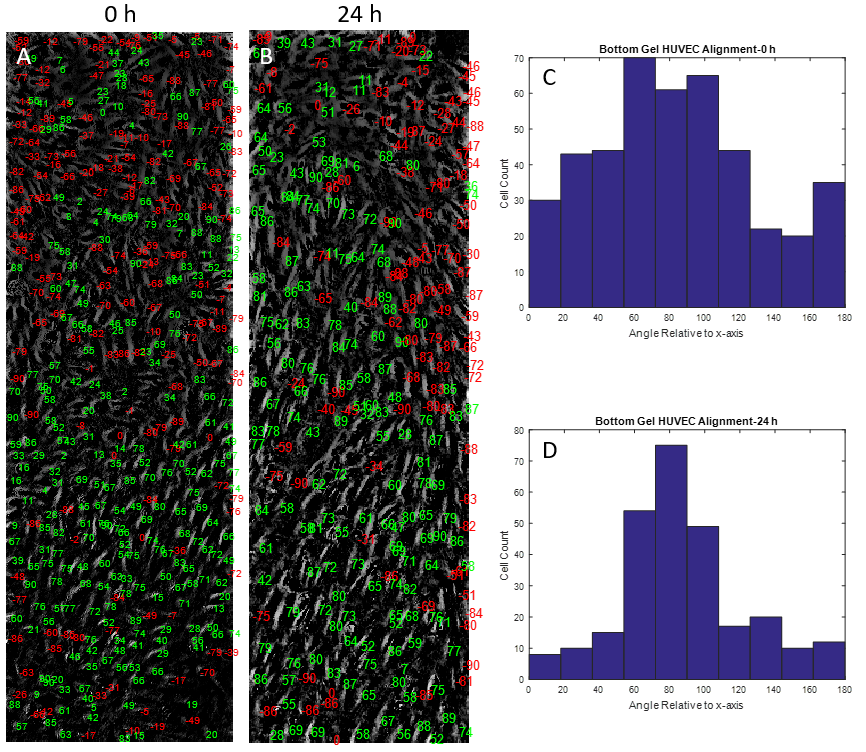
Run 2
Figure 4. Matlab based alignment semi-quantification of HUVECs seeded directly on the NPN chip with collagen I gel on the reverse side (RUN 2). (A) Matlab output of major axis angle (relative to the x-axis) of HUVECs before flow set on top of cell image. (B) HUVEC angle of alignment relative to x-axis after 24 h flow. (C) Histogram plot of A, angles changed to reflect y-axis alignment. (D) Histogram plot of B.
Statistical Analysis
The next step in this data analysis is to perform some form of statistical analysis. Comparing real alignment data to a set of randomly generated alignments may be a good place to start. Also, comparing the frequency distributions of the before flow and after flow alignment histograms may provide some level of significance.
Example Shear Calculations with 1um Polystyrene Beads
Matlab Video Processing
Using matlab, the video seen above was converted to gray scale frames, which were then converted to binary images (Figure 5). Matlab then tracks the center of the particle over 5 frames and calculates a distance traveled in pixels, distance traveled in um, and velocity in um/s.
Figure 5. (Top) Images showing particle trajectory over 4/30 s. Each picture represents a frame of a video shot at 30 fps. The particle circled in red was used to obtain velocity. (Bottom) Data from matlab analysis on particle velocity.
Using the formula for shear flow through a slit:
τ=6Qμ/(wh^2 )
I calculated a shear at the surface of the gel of about 0.093 dyn/cm^2. The expected shear at this level is around 6.5 dyn/cm^2.
Over the weekend, I resubmitted our adult Adipose-Derived Stem Cell (ADSC) paper titled: Membranes Promote Endothelial Differentiation of Adipose-Derived Stem Cells and Perivascular Interactions There were three main findings: 1.) ADSCs can be induced to express CD31 (PECAM-1) like endothelial cells. a.) Several prior studies used Vascular Endothelial Growth Factor (VEGF) at 50 ng/mL to…
Here’s the latest news from the production front: We are still struggling with the pinhole issue. Last week, Chris and JP tried a matrix of conditions to try to eliminate the particle contamination. Efforts included using the CO2 snow cleaner and a piranha solution clean. After etching the first wafer which saw only the piranha…
I finally got some MATLAB code working which calculates permeability coefficients (P, in cm/s) from a non-sink, generalized equation. This data is from (n=5) fluorescein (MW~370 Da) transport experiments in the Tecan (time vs. receiver well concentration (Cr) values). In this first set of data, I used polycarbonate and polyester transwells, at room temperature, without…
In order to test the efficacy of any dialysis treatment, we need induce uremia in our animal model. We choose to forgo the surgical approach of performing a 5/6 nephrectomy via ligation for the simpler diet based approach. Feeding the animals a diet containing adenine is meant to raise the level of urea in the…
Introduction When searching for a flow control system for microfluidic cell culture, we look to balance the ease of use, accessibility, and precision of fluidic control. For instance, researchers have explored different powered actuation methods for miniaturized precise proportional fluid control. These actuation methods include electromechanical, electrostatic, electromagnetic, piezoelectric, and thermal-based. The necessary power sources,…
These are the sieving curves for 50, 75, and 100 nm NPN membranes. The 75 nm NPN 30 nm gold data point is just an estimate, since the membrane broke before enough filtrate could be collected for an absorbance measurement. However, our estimates of zero gold tend to be pretty good (gold is very visible in solution,…