Adsorption Test of PEG4, IgG and BSA
Discussion: The BSA may have not been fresh enough to give good data, the difference between background and signal are pretty low. The Rhodamine IgG gave better signals but the PEG4 treated SiN is between the untreated SiN and bare pnc-Si. The latter having a lower signal.
Here are the details.
The fluorescent BSA was old stock from the freezer, the IgG was newly purchased Rhodamine tagged. Rhodamine Red-X Goat Anti-Mouse IgG (H+L)
Both were 1 mg/mL.
I tested on three substrates, Bare untreated SiN, PEG4 treated SiN, and UV ozone cleaned pnc-Si (as a positive control).
One set of chips was incubated in the refrigerator (2 hours) with SA, one with IgG, and one set with PBS. All chips were rinsed by spraying DI water, from a bottle, for 1 min after incubation.
The first graph shows the levels, measured with ImageJ, from the six substrates incubated with PBS. These are used as background levels as there is no BSA or IgG here. It is encouraging that the substrates all have similar background levels.

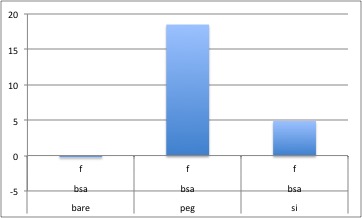
The raw BSA data is shown below. The measured values are quite low, not much above background. In fact, the Bare SiN is lower or equal to the background.

Subtracting out the background, it looks like I’m not really measuring much, if any, signal from the f-BSA. I’ll say again, it may be too old to be any good.
Here are the raw rhodamine values, note that these signals are much higher than the BSA values.

subtracting the background… The PEG4 is right between the Bare SiN and the Bare pnc-si.

I didn’t normalize the data as this would have hidden the fact that the BSA signal was so very low.
The IgG is sticking to everything.