In-situ heating experiments on the OSO and NSN samples
I have been working on the in-situ heating experiments on the free-standing membranes in the past few weeks. After quit a few times attempts I finally have some good videos made from the TEM images that were taken during the in-situ heating process. First I’ll introduce the background of these two videos including sample info, heating process and so on.
Sample info: free-standing OSO302530 and NSN302530 membrane(25nm thick a-si, 30nm thick SiO2 and Si3N4)
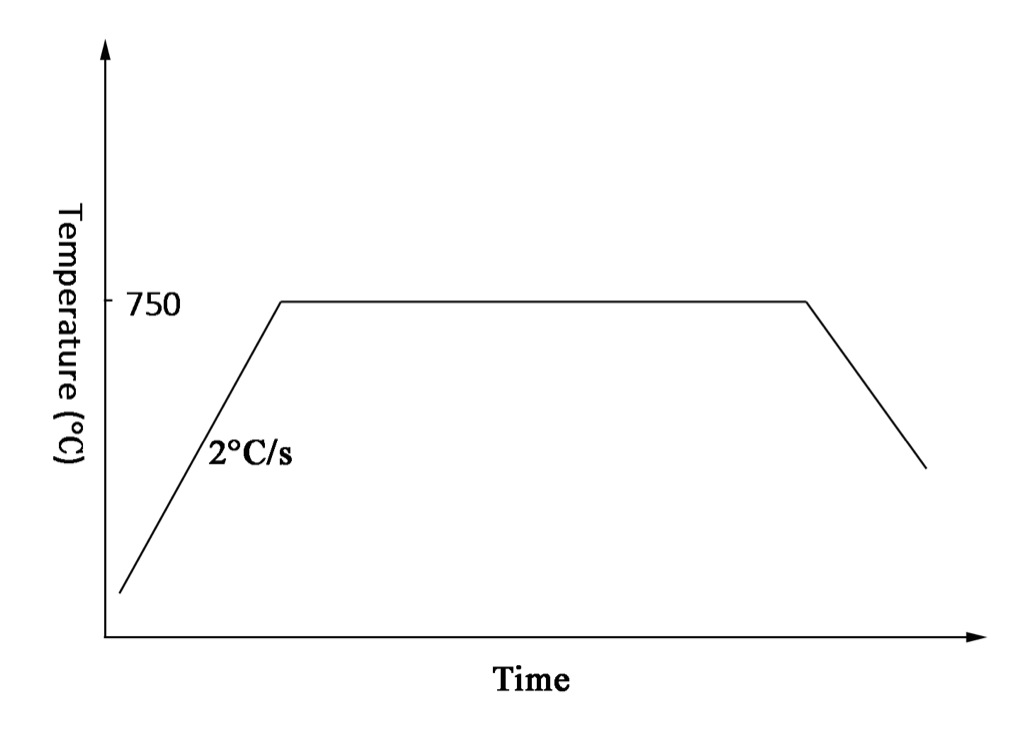
Heating process: the temperature was set to 750C and the ramp up rate was set to 2C/s. After ramping up, samples were then holding at the set point and images were taken when the crystallization took place. The heating was stopped until the amorphous silicon was fully crystallized.
The first video is from the OSO sample.
In-situ heating of sample OSO302530
During the ramp up stage, the sample was drafting very badly and it seems that the thermal drafting is directly related to the ramp up rate. It took around several minutes until the drafting became not so bad after the temperature reaching at the set point. The crystallization behavior, here I mean visible Si crystals, took place after the OSO sample stayed at 750C for 22 minutes. Images were taken every 2.5s and the heating stopped after the Si was fully crystallized. The total soaking time at 750C was 60 minutes, which means the actual time for this video is around 38 minutes. Almost 900 images were taken during the crystallization process and around 700 images were used in this video since there is little change after 700 images. Each image is played for only 0.2 second in this video, which means the speed in this video is more than 10 times faster than the actual speed. In case you wonder the scale bar, here is a TEM image before stop the heating with the same magnitude as in the video.

Now let’s talk about this video. In this video we can clearly observe the crystallization of amorphous Si and the nanopore formation. It looks like amorphous Si film starts crystallizing after soaking at 750C for a while. Nanopores (maybe pits) which surround the Si nanocrystals are formed at the same time. In other word, the localized crystallization involves the rearrangement of Si atoms, which results in the pits/pore formation surrounding the Si crystals. With the heating continues, Si crystals keep growing in lateral directions, which is due to the thickness confinement. Meanwhile, the pores/pits are moving from the amorphous/crystalline interface towards the amorphous matrix. It seems that the pores/pits movement facilitates the Si crystallization. In reality, it is the Si crystals growth, which attracts the nearby Si atoms to form the ordered crystal structure, that causes the pores/pits movement. One interesting phenomenon is that these pores/pits not only coalesce/merge with each other but also segment/break into more tiny pores. This is something we have never seen before. The Si crystals keep growing until they impinge with each other which indicates the fully crystallization of Si film. That’s why the pores/pits stop moving since most of the amorphous matrix is pretty much consumed.
The second sample, NSN membrane, shows a similar phenomenon but different pore morphologies.
In-situ heating of sample NSN302530
The heating process for this sample is same as the previous one. A few of Si crystals started showing up after soaking at 750C for about 10 minutes however no clearly crystal growth nor pore formation was observed. Images for the video were taken after 19 minutes soaking at 750C. A total number of 1200 images were taken which was corresponding to 50 minutes in reality. The magnification is the same as the previous sample.
This video shows the similar phenomenon of Si crystallization and pore formation but very different in terms of the Si crystallization and pore growing dynamics. In this sample, nanopores/pits shows up with a very clear ‘pearl necklace’ pattern and both the size of these pores/pits and the diameter of this ‘necklace’ pattern grow bigger and bigger with the crystal growth. Here the ‘pearl necklace’ is to describe that these pores/pits look like pearls that surround together in a necklace (circular) pattern. Pores/pits starts coalesce when they meet each other. Similar phenomenon of the pore segment is also observed in this sample. The most obvious differences between these two videos are the pore moving speed and the pore morphologies. Since both videos are played at same speed (0.2 second per image), it is fair to directly compare the pore moving speed from these two videos. In the OSO sample, lots of small pores/pits move relatively fast compare to those in the NSN sample. I think one reason may due to the small size of these pores/pits. Another difference is the pore morphology evolution during the heating process. It seems that the ‘pearl necklace’ pattern is well maintained in the NSN sample despite the growing of the crystals before they impinge each other. Meanwhile, pores/pits become more elongated during growing of the ‘pearl necklace’ pattern. However, in the OSO sample, the ‘pearl necklace’ pattern is sort of clear at beginning but becomes unclear with the crystal growth and pore moving. Also these pores/pits do not grow as much as they did in the NSN sample.
Clearly the OSO and NSN samples show very different crystallization and pore growing dynamics even though they all start with the ‘pearl necklace’ pattern. This clearly proves that the difference of the crystallization dynamics between the OSO and NSN stacks greatly impact the pore formation and growing process, which results in the final difference of the pore characteristics such as pore size, porosity and so on. The in-situ annealing technique is very helpful to reveal the Si crystallization and pore forming process, which would help us to further understand this unique phenomenon. Any comments and suggestions are very welcome to help the further investigation.
These images are great. I don’t know if I agree that the pores move faster on the OSO sample, but they certainly follow more complex paths that lead to break-up and coalescence. The pores seem to move more freely along a straighter path in the NSN sample, enabling the ring to be better maintained.
However I think it is best to analyze in terms of the Si crystallization, not the pores. I think we now know that most of the pores are created due to thickening of the Si layer in areas where crystallization starts, drawing material from thinner areas, creating voids. In the NSN, since the voids form so readily and maintain the ring so well, it restricts the flow of Si into the growing crystal, slowing things down, and allowing the ring of void to grow in a stable manner. In the OSO, the voids seem to be smaller and less defined, and do not seem as free to move outward as the central crystalline area grows. This appears to allow the crystal to be less confined by the void and be fed much more readily by the surrounding Si. The crystal growth breaks free of the ring of void and significantly accelerates crystallization of the whole film. As the crystalline fingers race past and through the void ring, individual viods are forced not only outward, but also laterally, creating all the complex paths in the video.
This is definitely neat stuff and would be worth a long discussion at some point. It would be great if you could find a way to get some quantification of the speed of movement, linearity of pore trajectory, rate of expansion of the ring, etc. It would also be interesting to see how the Si and sandwich layer thicknesses affect these dynamics.
Thanks for sharing this data!!
Thanks for your comments Chris! I think I was trying to say that pores from the OSO sample seem move more obviously in visual. I agree that the Si crystal growth is confined by the surrounded voids ring in the NSN sample where in the OSO sample it’s more complex. One thing that is worth discussing is the pore size growth in these two samples. Clearly the growth of the pore size, though mostly in the elongated direction, is much more obviously in the NSN sample. Do you think it is also due to the confinement of the middle Si crystals from the outside ring? I’m trying to understand it from the pore growing perspective to the crystals growing.
I should be able to quantify the clear pore’s moving speed, trajectory and the ring expansion rate. I’ll update with these data next time.