Fluorosphere wash and measurement with Tecan and Fluorescent microscope
Karl and I have been working to measure separations using SEPCONs with particles ranging in size from 20 nm to 1 µm. We started out naively enough by slightly diluting some flourospheres we found in the refrigerator, putting them in the TECAN’s nanoquant plate and pressing run. I know. Ha ha.
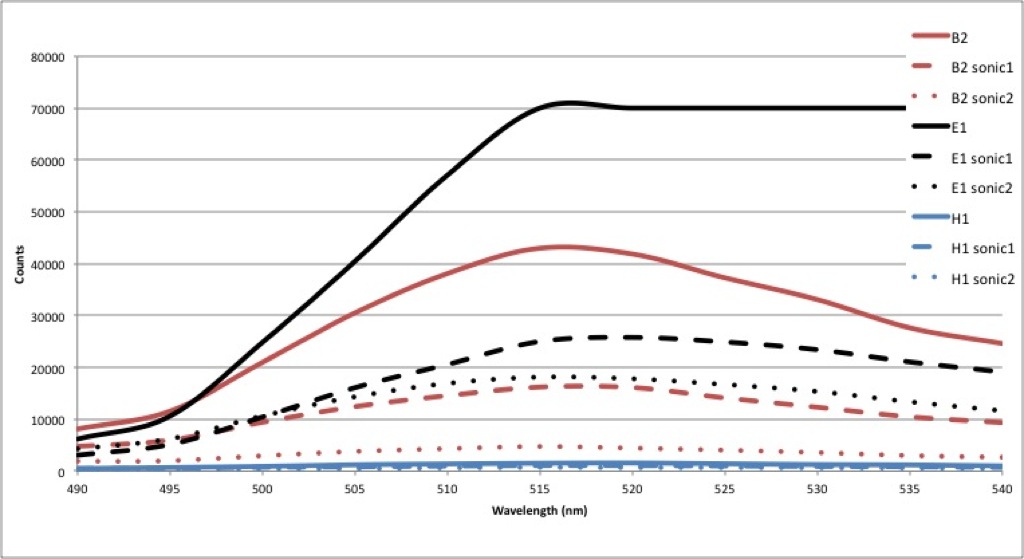
The first point we should make is that cleaning the nanoquant plate is not as simple as wiping off the wells. We found that using a high concentration of fluorospheres (e.g. undiluted, 2mg/mL) resulted in a residual fluorescence that required several sonic baths to reduce. In the plot below we show the fluorescence of 505/515 particles excited at 450 nm. Well B2 starts with a fluoresence beyond the range of the detector with the gain set to 162, and then reduces after each sonication. E1 does the same, but starting from a lower level. Well H1 maintains a low signal from beginning to end.
Depending on the gain you use and the concentration of fluorospheres you are testing, you may or may not need to clean the nanoquant plate very well before adding your sample. No matter what, you should always run a baseline before adding your samples to ensure you measure your material and not the residue from a previous test.
Along the same lines, various NRG members have suggested that when measuring fluorescence with the TECAN, we may be getting a signal from fluorescent material free in the solution as well as a signal from tagged particles. To test this, we attempted to centrifuge fluorospheres from invitrogen of sizes 20, 100, 200, 500, and 1000 nm.
According to the following site, http://probes.invitrogen.com/media/pis/mp05001.pdf , ” Centrifuge to separate the protein-labeled microsphere particles from unreacted protein. The time and speed of the centrifugation will vary with the diameter of the microsphere particles.As a guideline, 0.5 µm particles and smaller should be centrifuged at 25,000 × g for 30–60 minutes. Particles 1.0 µm and greater can usually be sedimented at 3000–5000 × g for 20 minutes. It may not be possible to centrifuge 20 nm and 40 nm particles without extended spin times.”
We used the Allegro X-22R centrifuge because the baskets rotate to spin horizontally so that all particles pelleted at the very bottom of the tube. It looked as if the 500 and 1000 nm particles had indeed pelleted out after 30 minutes at 15,000 RCF, the 100 and 200 nm looked pelleted out after an additional 30 minutes. The 20 nm particles never pelleted and were ignored for the rest of this study.
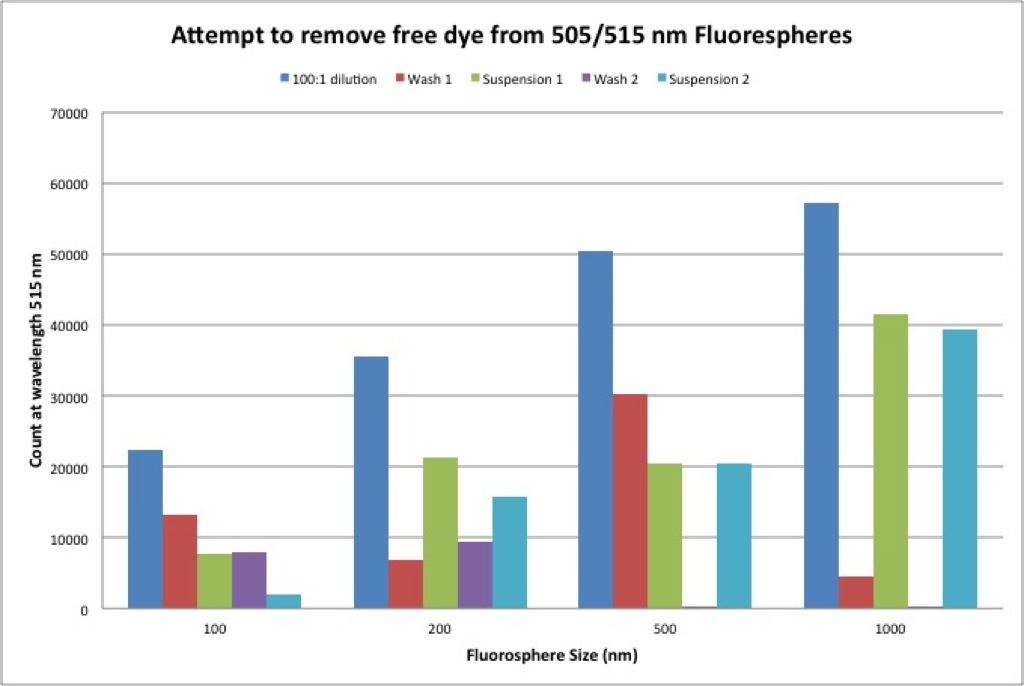
The solution on top of the pelleted material was pipetted off and labeled as “wash 1” while the pelleted material was resuspended, vortexed, and labeled as “suspension 1”. The centrifuge was repeated to create a wash 2 and suspension 2. The resulting fluorescence of each solution is plotted in the figure below. The excitation wavelength used was 450 nm. The emission was measured at 515 nm.
The 1000 nm particles behave as expected. The wash 1 sample shows roughly the amount of fluorescence lost when going to suspension 1. An additional wash shows almost no signal in wash 2 and a similar signal in suspension 2. So one wash should be sufficient for 1000 nm particles.
For the rest of the particles, it was not as clearly a successful removal of free dye.
Another suggestion from the group was to use the fluorescence microscope to look as the solutions and compare the signal from the background to the signal from the particles for each solution. Henry assisted with the measurements below. These measurements are from a quick test with 200 nm particles, not associated with the samples above. (I tried measuring all of the above samples, but the software was hanging up in the end the images were not useful. We are trying to get the matlab license renewed on the microscope computer to make measurements easier in the future)
The data below is illustrative of the importance of the washing process.
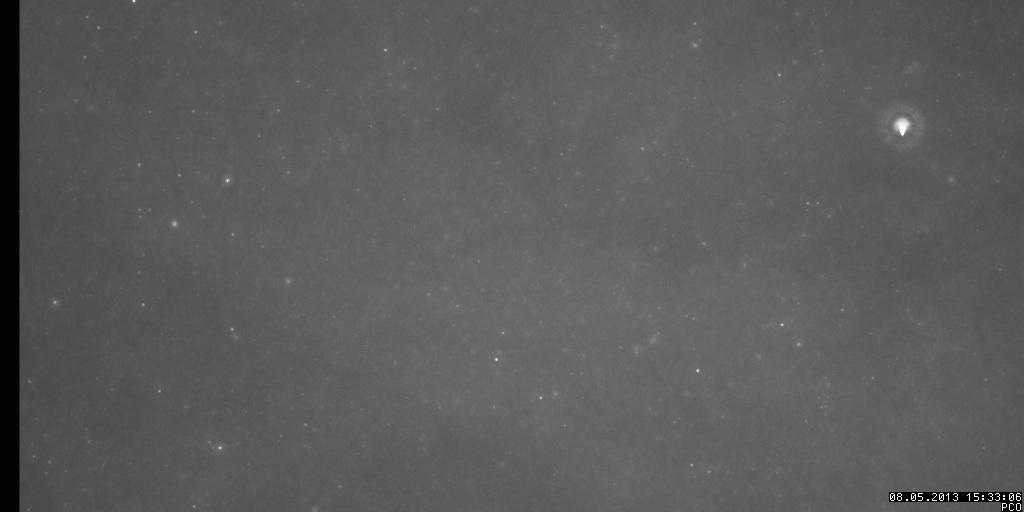
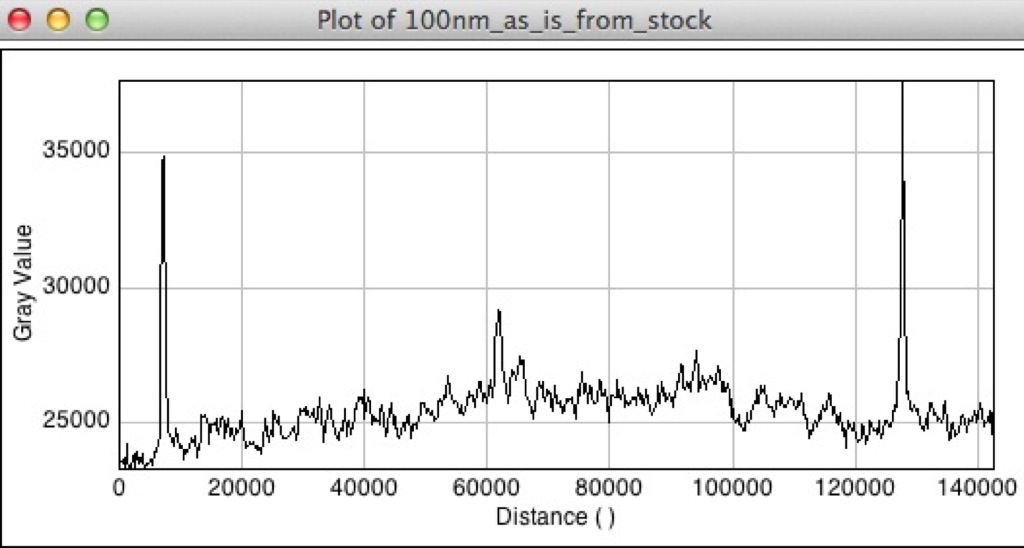
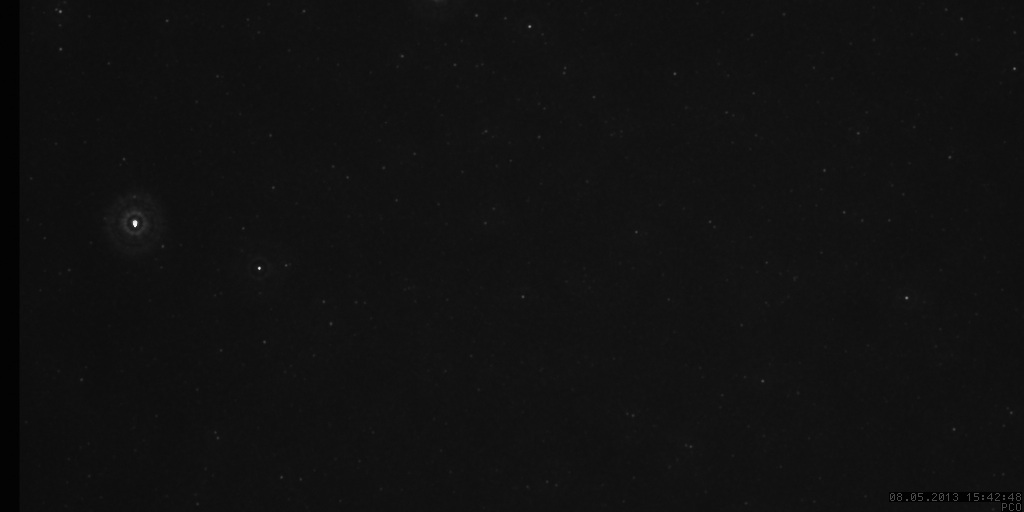
First we see and image of the stock solution diluted 100:1 in water. To the right is a line scan that measures a background of ~25000 with two particles peaking at~35000.
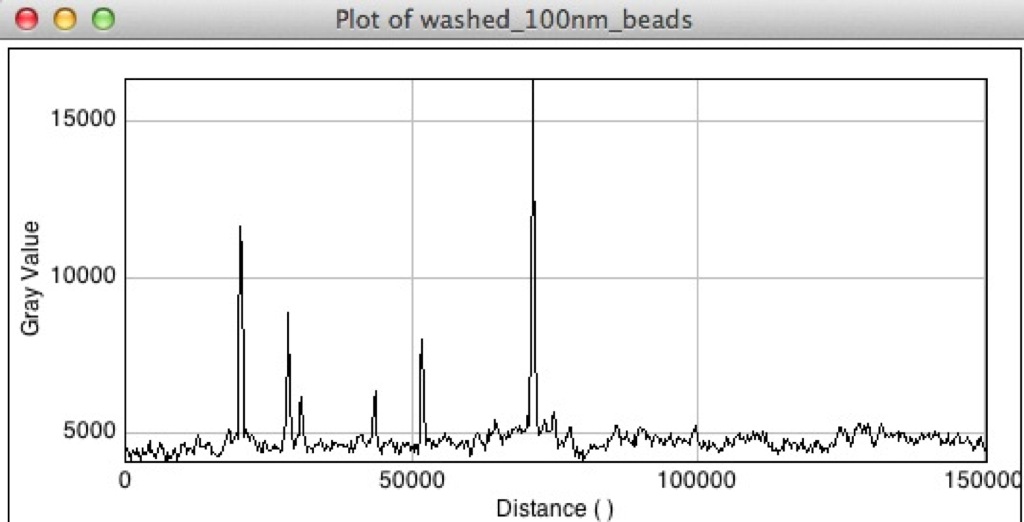
Next is the plot of the particles after having been washed and resuspended. Now the background is down to ~ 4000. (Although the peaks have also come down to ~ 10000-15000.)

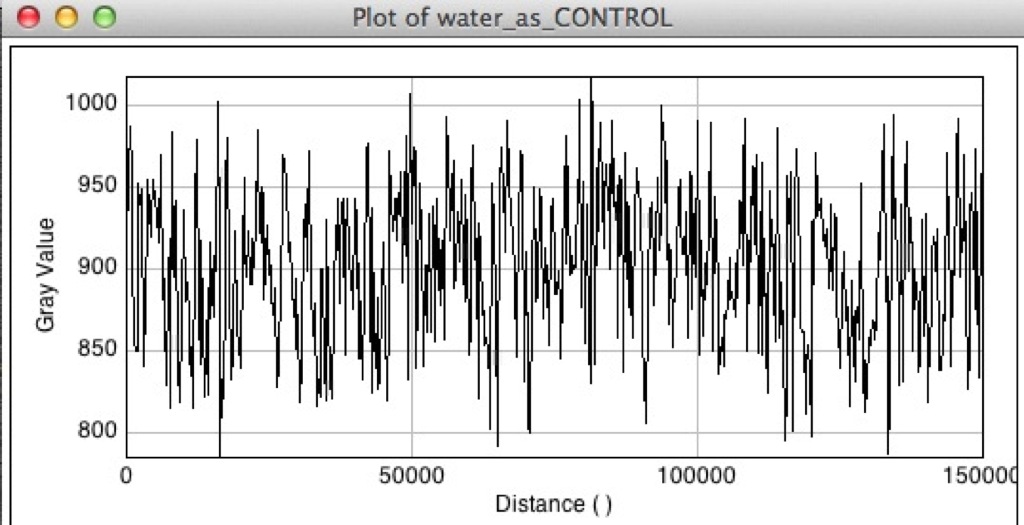
And finally we have the signal from water at ~ 900.
Plenty of work left to do:
-Find way to sonicate particles to break them up. Do we have a probe somewhere?
– Use higher RCF while centrifuging. We need to try the larger, scarier looking centrifuge in the lab.
– Continue to define baseline parameters such as gain settings, standard dilutions, fluorescent microscope settings, etc. Once we have a better handle on all of this, we will write up an SOP for testing separations.
There are a few odd features in this data, but I think it mostly makes sense. Clearly, there is substantial background fluorescence in these solutions that is not associated with the particles. Were all these solutions old or were some new? I’m not sure how the fluorophores are bound to the particles, but it is not unreasonable to assume that there is a slow decomposition that frees these molecules form the particles. I have to assume that when they are made, this residual fluorescence is removed, so newer solutions would likely have less background.
Just for clarification, in the Tecan work, both the 500nm and 1000nm particles behaved normally, right? You indicated that only the 1000nm material was normal, but the 500nm stuff looks OK to me too.
Thanks!
The 20 nm particles we couldn’t pellet were “old”. The four other sizes are brand new as of this month. In the future we will try to repeat this test over a week or two to see how quickly the background signal goes up.
In the Tecan work, the 500 nm particles probably did behave normally. I’m a little confused by how high the signal is in wash 1 and how much lower the suspension 1 and 2 signals are than the initial sample. But perhaps it could be explained by accidentally pulling off some particles from the pellet while removing the wash.
Thanks! – Josh
We have a tip sonicator that would do the trick.
What is the evidence that the particles are agglomorated? Is this after centrifugation or before?
I’ve seen some large particles in the microscope from samples before or after centrifugation that might be agglomerates, but I can’t say for sure.
The manufacturer strongly suggests sonication, so I thought we could give it a try.