4-point probe measurement results
Dave and I characterized the membrane samples using the 4-point probe system at Kodak research Lab. It is NOT the previously discussed micro-4-point probe. The spacing between two probes is about 2mm.
We first tested a quarter bare wafer#388 at five points (see the diagram below). The average sheet resistance is around 80 ohm/square.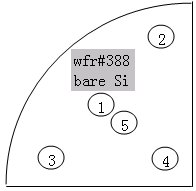
sites (1) 80.248, (2) 82.185, (3) 83.04, (4) 77.86, (5) 80.446
Then we tested another quarter of wafer#388, but deposited with 15nmTi+15nmAu. The average sheet resistance is about 8.1 ohm/square, reduced to 1/10 of the bare Si.
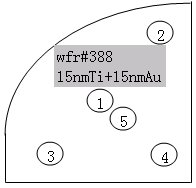
sites (1) 8.1696, (2) 8.073, (3) 8.2856, (4) 8.2552, (5) 8.0592
Since I also processed wafers #316 and 318 with the same metal films, we tried to measure these “skeleton” wafers around the edges. Both wafers have sheet resistance about 7.3 ohm/square.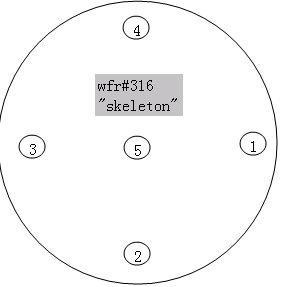
sites (1) 7.9648, (2) 6.9021, (3) 7.0888, (4) 7.0472, (5) 5.6674
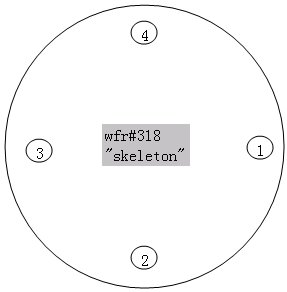
sites (1) 6.9567, (2) 7.7161, (3) 7.3234, (4) 7.8417
I think these results are quite consistent with the output of the 2-probe analyzer at RIT test lab, which gives a resistance of about 20-25 ohm.
Looks good. Did you get I-V curves? I would like to have those for publication. Also,
1) The numbers are lower than the RIT #s because of the elimination of contact resistances, etc. Right?
2) What was the difficulty with the micro probe?
3) We still haven’t probed across a suspended membrane, correct?
Lingyun – Please do the calculation and show us that the measurement at RIT gives the same result as the 4-point probe, since you are reporting in two different units. Didn’t the RIT system show a 1000X difference between two of your samples?
Why is the skeleton wafer giving lower resistivity?
Thanks.