Blood brain barrier 2-color fluorescence
I’ve been trying to get multi-color images of endothelial cells and glial cells on transwell membranes in order to compare image quality on glass, pnc-Si and polymer membranes. Specifically, I’ve tried staining endothelial cells green with VEGF mAbs and glial cells red with neurofulament H (NFH) mAbs but VEGF expression in bEnd3 cells is extremely low. Therefore, it’s been difficult to pick up the green fluroescence. On the other hand, NFH labeling has been really nice.
To get around this limitation, I’ve switched to loading bEnd3 cells with calcein AM for green fluorescence and keeping glial cells red via NFH immunofluorescence. This seems to be working pretty well, as shown below (this post just shows images from PET transwells). This is a tricky work-around – I can add calcein to the bEnd3 layer only and not label the glial cells because the bEnd monolayer is enough of a diffusion barrier that the calcein won’t label glial cells green at this timescale.
Here, I stained bEnd with calcein AM, followed the normal IF protocol for NFH and then labelled the bEnd with Hoechst to stain the nuclei. This is all 3 channels, at 20X:
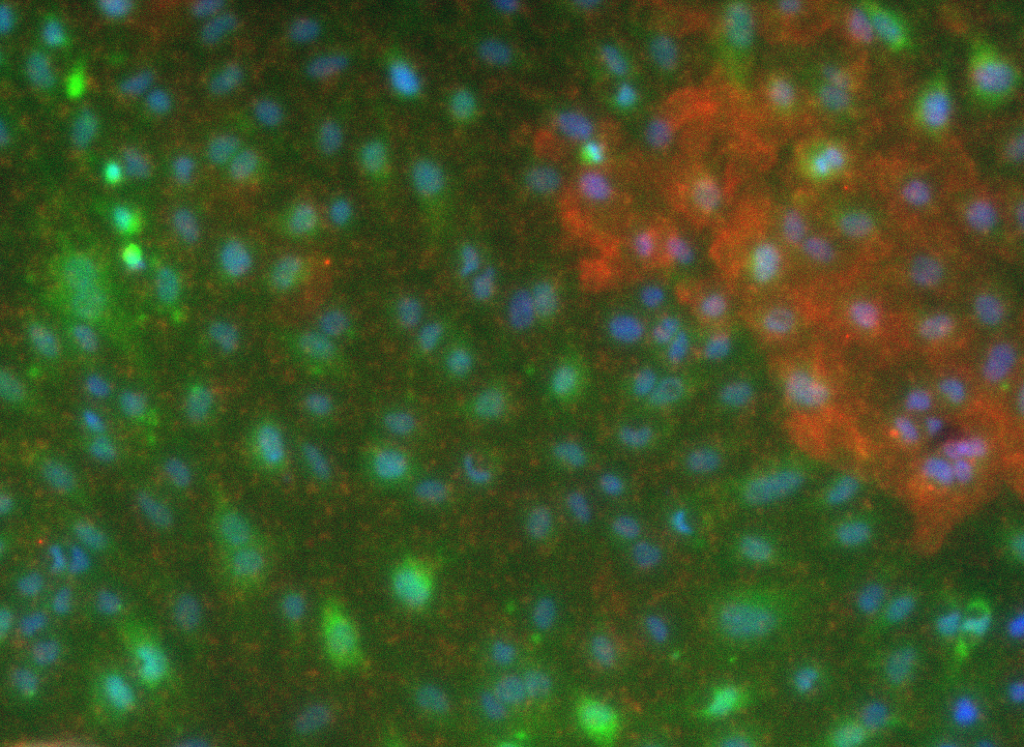
You can see perfect correlation of nuclei and green endothelial cells and blurry red fluorescence emanating from glial cells on the far side of the PET membrane. Notice the autofluorescent pores in the PET membrane that were also obvious in my previous post.
On pnc-Si at 20X, there is much less background fluorescence. Additionally, intracellular morphology is visible in both cell types whereas on PET, the glial cells appeared as red ‘blobs’.

I then went up to 100X for higher resolution images:
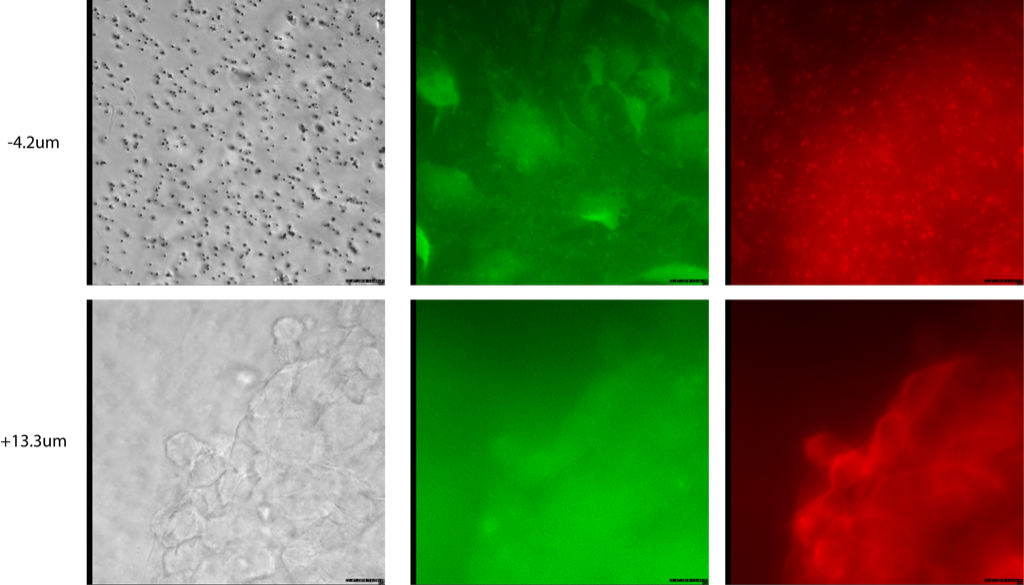
Here, I’ve displayed DIC, green and red channels at 2 different focal planes. At -4.2μm, endothelial cells are barely discernible by DIC but easily visualized thanks to green fluorescent calcein. There is a bit of red fluorescence in this focal plane that originates from the glial cells. At 13.3μm (above the previous focal plane), you can clearly see glial cells in DIC and perinuclear red fluorescence due to NFH labeling. There is some bleed through of red fluorescence in the green channel (this is a TRITC secondary Ab). This panel shows that these co-cultured cells are separated by ~ 17μm. Note that these images are as-is – no post-processing to enhance birghtness, etc.
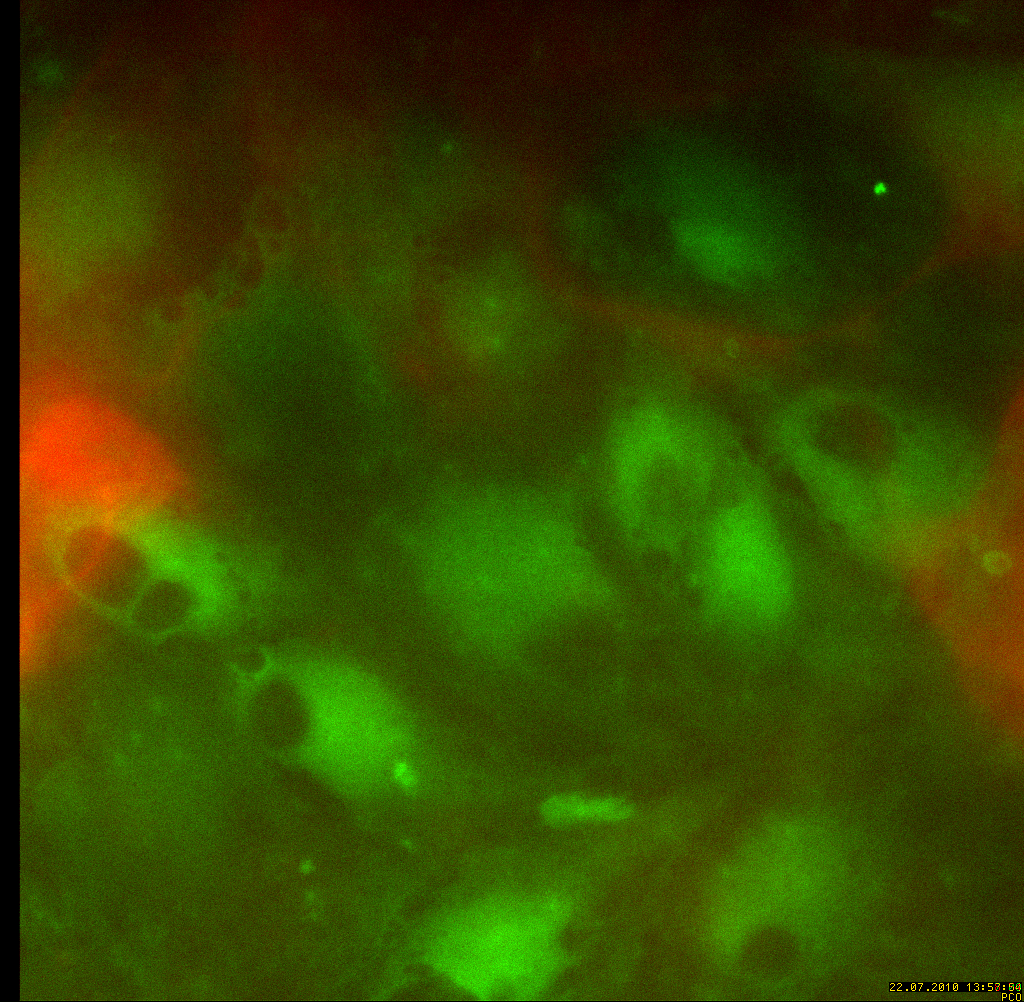
The following 2 images are from 2 different ROI with the green and red channels merged to show the distinct cell types simultaneously:

Now I need to repeat with pnc-Si at 100X.