Attempt at movable cutoffs
In the next paper that I’d like to publish, I will compare protein separations for two membranes with different pore distributions to a single membrane at two salt concentrations (basically a redo of this post). My most recent trial with this had less than stellar results.
I chose two wafers for movable cutoffs – SC 526 and SC 527. Here are the pore distributions:


In both cases, very little protein diffused through according to the gel:

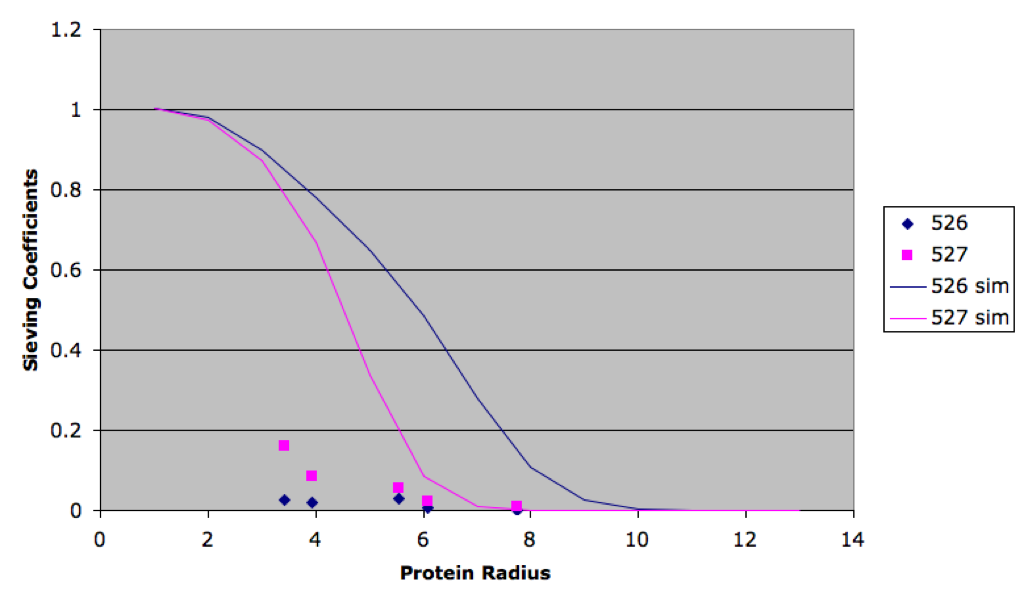
Results of the densitometry, while noisy, showed that more protein passed in the case of 527, which actually had a lower cutoff:

Pores look normal in the images, but according to Nakul the permeabilities in these wafers are lower than normal. I’m not sure why these wafers are anomalous, but if we do have new wafers with different cutoffs, I would like to try diffusion separations for my paper.
UPDATE:
Here is the data from above with the simulations based on the pore characteristics:
UPDATE #2:
I’ve rerun this experiment with oxidized membranes. Here is the gel:

You can see that there’s a little protein diffusion through 526 this time but still very little for 527. Here is the densitometry of the results:

The diffusion through 526 does not quite match the simulation yet. Perhaps the oxidation helped a bit in the wetting, but these wafers are still not quite as easy to use as the previous ones.
These are not the same wafers as Dave, but the numbers are close. Are we experiencing something systematic in manufacturing that is making them less permeable than they seem by TEM?
I don’t see anything that concerns me in the TEM images. The pores are open and the histograms are reasonable by my eyes.
We really should be doing air-flow measurements on all these samples because I think this is a wetting issue. If the air-flow data matches the TEMs, it would be a strong indicator that we are either not wetting all the pores or we are clogging them rapidly.
Dave gets much better results when he pre-soaks with ethanol, but Jess’ data shows a far-worse drop in transport, considering it’s diffusion. It seems like only a small percentage of the pores are participating, so the problem is very severe. It’s worth trying to oxidize the samples, soak them in ethanol, displace with water/buffer and repeat the experiment w/o drying the membranes.
I have absolutely no idea why this would be worse now, but one thing to keep in mind is that we can’t really determine how sharp the pore entrance/exits are from the tem images. I have seen some evidence of thin films overhanging the pore edges, which may indicate that the pore walls are creating a very sharp corner at one or both surfaces. It strikes me that this could make wetting very difficult, if true. Can someone determine if there is a disparity between the gas flow and water flow rates, indicative of this type of wetting problem? Maryna – could you check the gas flow rate on a few samples and compare with the pore histograms? IF this is the case, the YES system could be very helpful, as gas-phase deposition should cover these corners and help with wetting. We could also try an oxidation followed by a BOE strip to try to dull the edges a little bit.