Stock Pile Experiment
This experiment is to determine if the time between the SC1 clean and when the wafers get deposited matter. Currently there is suspicion that an SC1 from an RCA clean should at RIT should be done right before deposition, . So what is done typically is that lithography steps are done weekly at RIT to fullfill wafer demands. Ideally, we would rather process the wafers in bulk and store them in u of r for when they are needed.
This experiment has 1 control. SC023.
2 wafers have a time of 2 weeks in between the SC1 clean and when the wafers get deposited.
Another 2 wafers have a time of 4 weeks in between the SC2 clean and when the wafers get deposited.
What we’re most curious about is if this influence the pinhole density which currently seems to be unsolvable. Below is a graph of the pinhole density of the old sepcon patterns so its not a full picture of the pinhole density trend of our entire production.
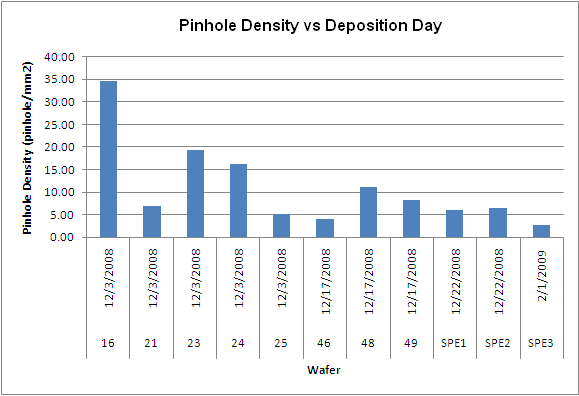
From the graph, it does show a shift in average pinhole density as time went on. So somewhere downsteam process is improving during the period of dec – feb.
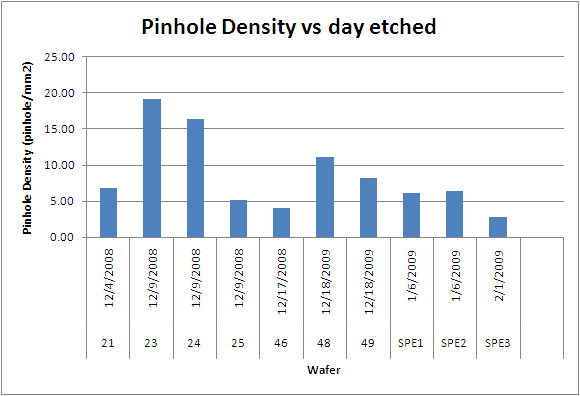
The graph above is a rearrangement of the earlier table but with the dates changed to show a trend in etching. Again, improvements in pinhole density can be seen.
Stockpiling wafers shows no increase in pinholes. Improvements in processing is evident and could be masking the difference between stock piling and not stock piling. Stockpiling wafers for deposition is a viable and would help reduce cost.
In the future, these graphs could be generated to show more than just the old sepcons and be used to analyze much more conditions.
Yahoo! Pinhole density quantified. This is precisely the type of graphical look at our progress I was hoping to see.