Water Permeability
I’ve been working on trying to fill in some of the blanks of the permeability paper, and I’ve been fiddling with the water permeability data. I plotted the old water permeability data as a scatterplot, and while there looked like they could be a linear relationship with porosity, it was definitely missing some medium porosity membranes. Encouragingly, we noticed that the new wafer 612 had a porosity that would fit it right into this void.
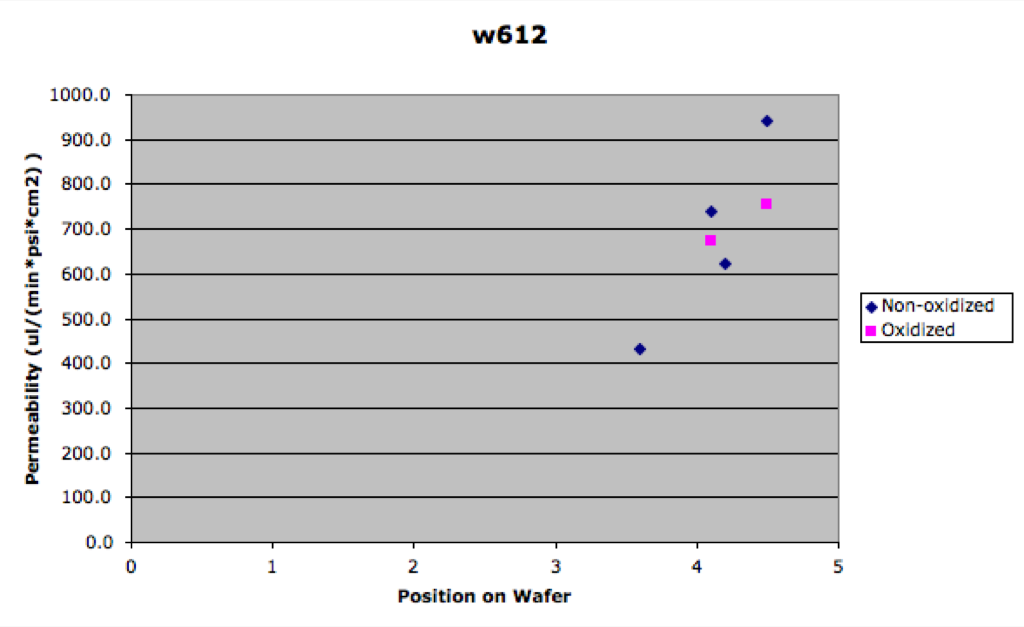
I started to perform water permeability studies in the EQ format with this membrane. I stupidly forgot to oxidize the first set of samples. I then did a set (of which only 2 survived) of oxidized membranes. The oxidized ones had very similar permeabilies to non-oxidized samples. After the permeability tests, I tried the wet-dry format. None of these membranes passed water in wet/dry. Here’s the permeability data for w612:
I updated the following chart to include the data from wafer 312, both experimental and theoretical. First off, I know some of you don’t agree with the way I perform pore processing. My porosities will seem high because I leave in many of the small pores. I follow an series of steps that Mike B. sent me, and I find that it does a great job at finding the pore boundaries. I use the same steps each time, so each image I do is very consistent with the others. I tried to change the thresholding and binary operations to get rid of those pores, but I’ve found superficially that this is not as consistent image by image. I can however try to remove these smaller pores from my .mat structure after processing, and that might be a little more reasonable.
At any rate, my point is that even though you may not like the porosities present in the following chart, they are consistent image by image. The full structures are fed into the theory, so that is also consistant with the image. The porosity that I report therefore is simply a label that I’m using to describe the specific image, and can be shifted if done so consistently through all the images. I hope that clears up the problem… maybe we can work together to find a solution that everyone agrees on.
Here is the chart of porosity vs permeability for water EQ tests:
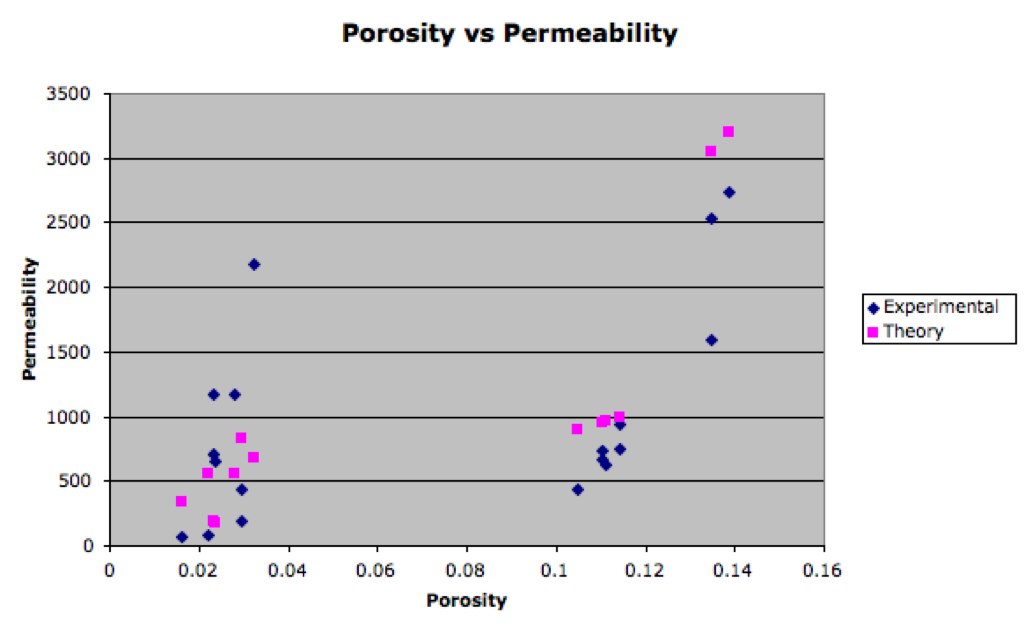
This was edited to show the correct porosities for the new wafer. The fit no longer appears to be linear. There’s a pretty good dependence on pore size in conjunction with permeability I think.
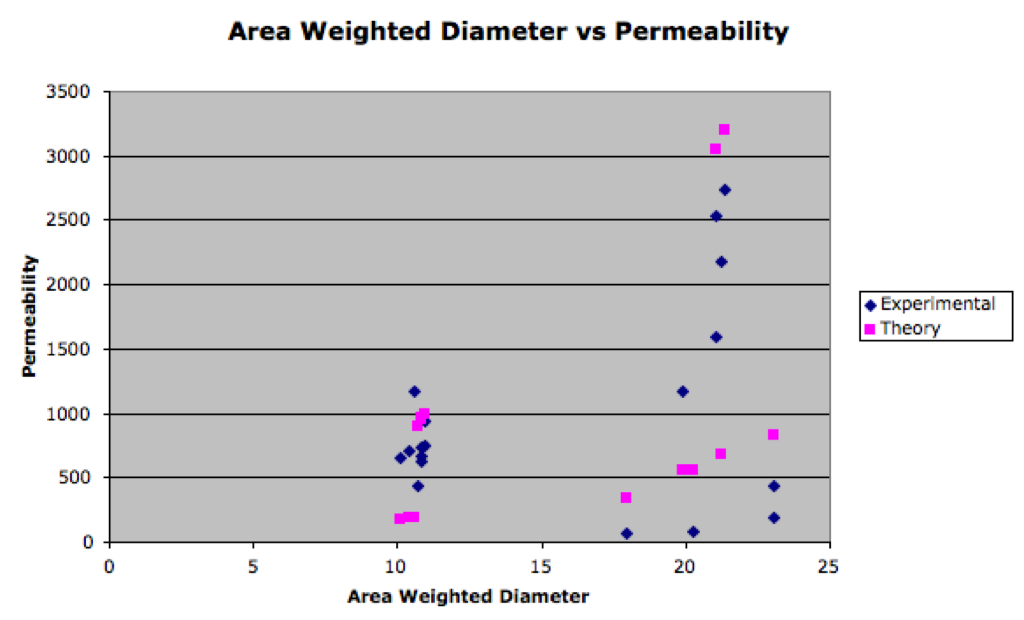
For comparison, here is a chart of the weighted diameter vs. permeability:
Here are a handful of bar graphs for re-imaging the data. I’ve removed data from w504 (which appeared to be anomalous). Errors are all standard error.
Porosity (doesn’t include w504)

Mean Diameter (includes 504)

Mean Weighted Diameter (includes 504)

Porosity does look like it is organizing the data reasonably well. The fact that the theory tends to be a bit higher than experiment could be an indicator that some of the background pores should not be included. This would lower the porosity and the permeability prediction for the theory points but it would only lower the porosity for the experimental points (since we are using the same images). So the small pore cut-off threshold in these images is a bit of a free parameter that could be used to adjust the agreement between theory and experiment. Since it is an arbitrary choice, we probably should tweak it to see if the best agreement still gives a reasonable interpretation of the pores in these images.
But first … can you make a bar graph version of the porosity figure so we can see where we are at?
I’m really pleased that the wet/dry format is again behaving as it used to. Tom should be able to wrap this up if we hold material for him.
Can we discuss this again on Tuesday? I’m getting confused about what we are trying to say here, and if I’m getting confused, I’m concerned about how this can be explained clearly to readers/reviewers in a paper. I still think pore size is the most critical parameter and that porosity is just a linear scaling factor in relation to permeability. I have difficulty interpreting the bar graph above where the change from 2% to 10% porosity (5X) shows a much smaller effect on permeability than the 10% to 14% (1.5X) increase in porosity.
Can you make a couple of more bar plots in time for Tuesday (or sooner if possible)? One should be your weighted average and the other should be average pore size. For both, I’m afraid we’ll only have two bins. Throw out w504 data and be sure to plot standard error of the means rather than standard deviation for error bars.