CAD-LB: Biomarker Detection Validation – ICAM-1 HUVEC Stimulation Model
Introduction
This post is another update in my series of experiments aiming to both characterize and validate the CAD-LB platform. We have now shifted our focus to validating CAD-LB biomarker detection which will be done using multiple experimental models. The most recent model, and the topic of this post, uses HUVEC cells to validate the detection of ICAM-1 on HUVEC-derived EVs. We know that following stimulation HUVECs exhibit a marked upregulation of ICAM-1; in these experiments we investigated if CAD-LB could detect increased percentages of ICAM-1+ EVs in the conditioned cell culture media of stimulated HUVECs. Following these experiments, we found that within the EV compartment CAD-LB indeed recapitulated the ICAM-1 expression relationship seen in parent cell counterparts.
Experimental Approach
HUVEC cells were cultured in both T25 flasks and 12-well plates and split into two groups. One group was stimulated with 1 ng/mL TNF-α (stimulated) while the other group was left untreated (unstimulated). After 24 hours, HUVECs in 12-well plates were stained for ICAM-1 expression using ICC methods while the conditioned cell culture media was collected from T25 flasks and used for EV analysis. CAD-LB was used to identify ICAM-1+ EV subsets in the conditioned media of stimulated and unstimulated HUVECs using our typical fluorescent dyes (CFSE & conjugated antibody targeting biomarker). Secondary antibody-only samples were used in ICC experiments for background correction. Label-only (no EV) and isotype controls were employed in CAD-LB experiments to quantify background labeling/capture and nonspecific labeling levels, respectively.
Results & Discussion
Representative images of stimulated and unstimulated HUVECs are shown in Figure 1A-B. As expected, stimulated HUVECs exhibited a large upregulation of ICAM-1; ICC reported an approximate 37-fold increase in mean fluorescence intensity (MFI) (Figure 1C).

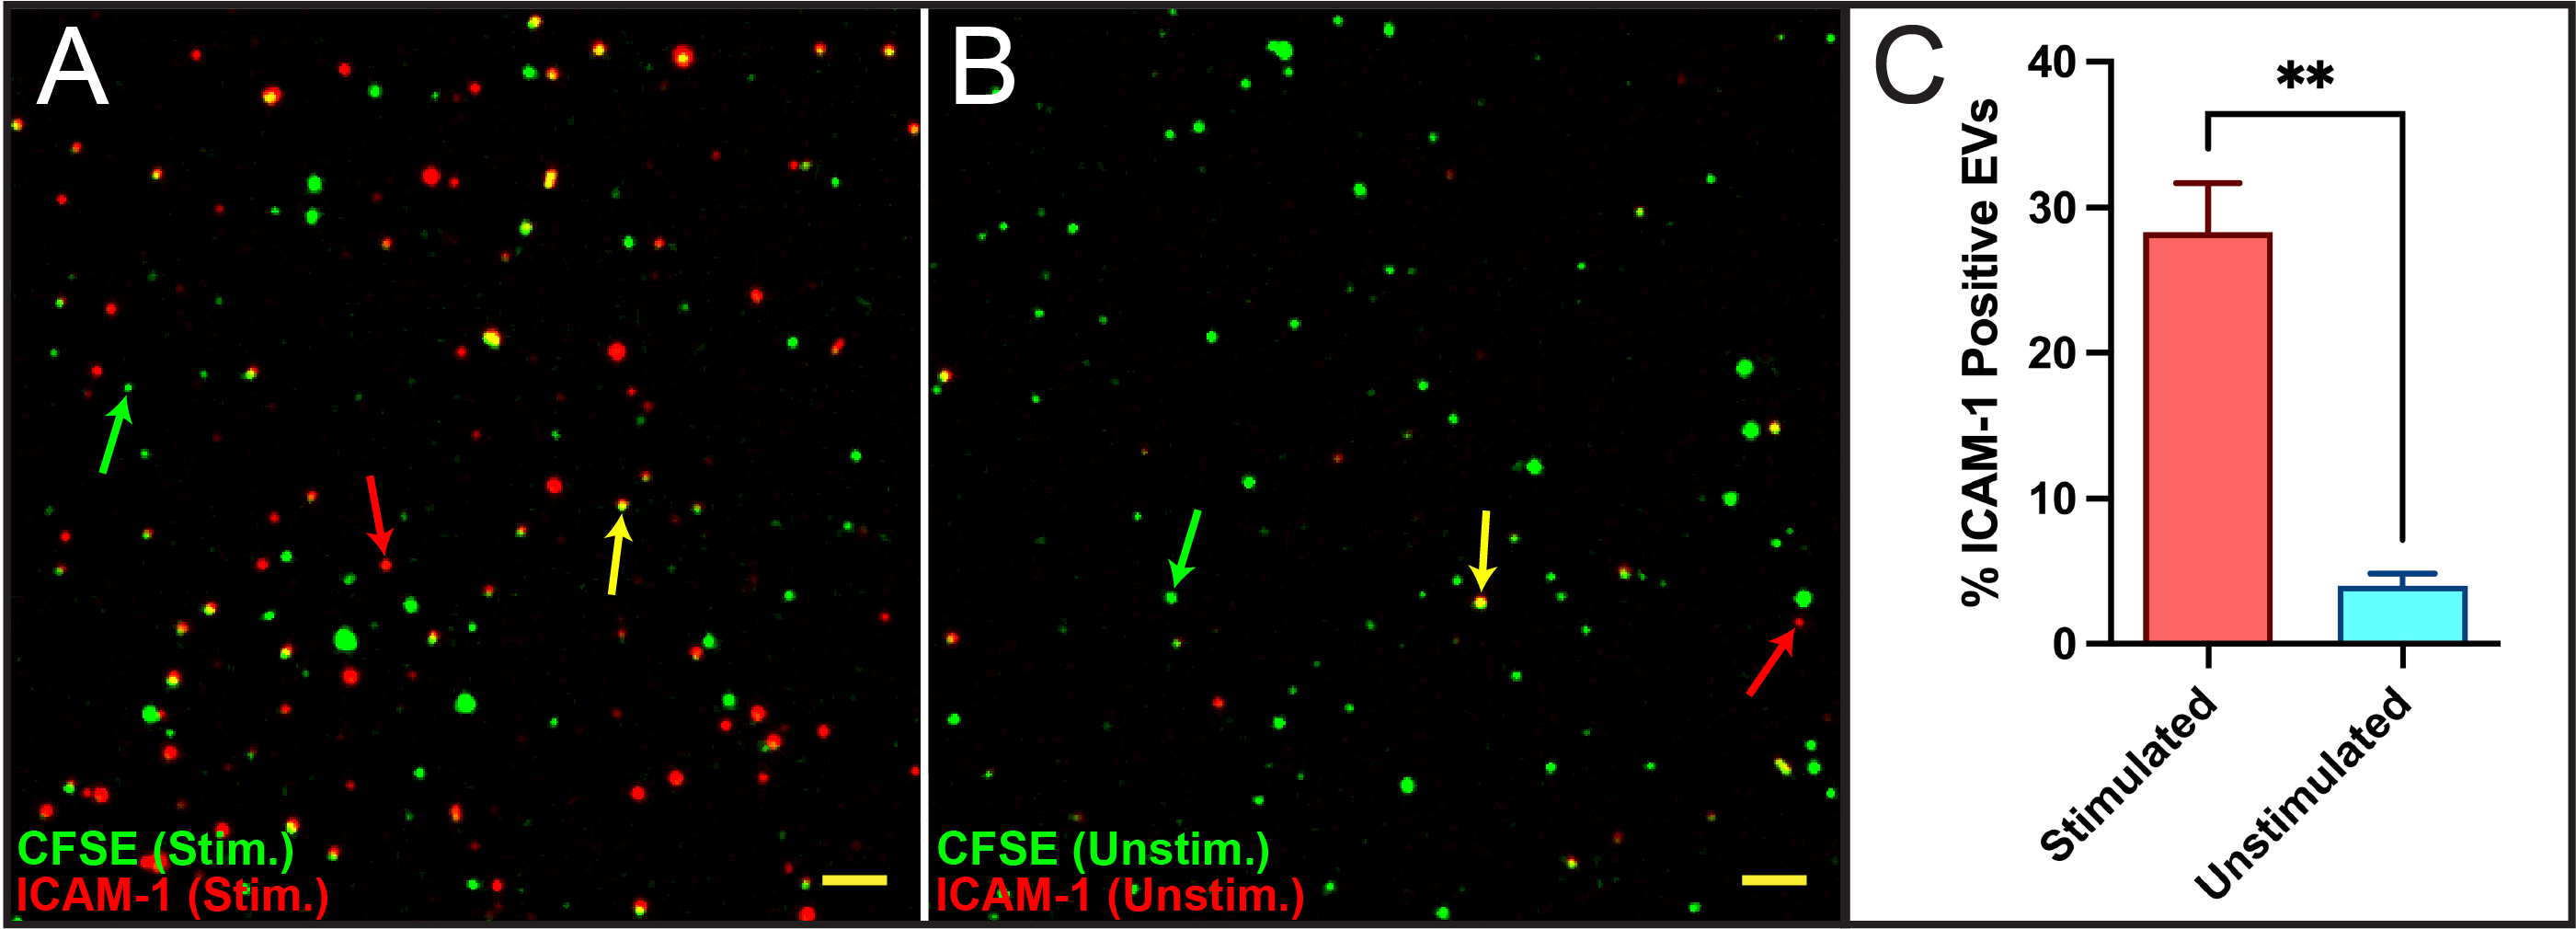
The results for EV experiments are presented in Figure 2. CAD-LB successfully detected ICAM-1+ EVs in the conditioned media of both stimulated (Figure 2A) and unstimulated (Figure 2B) HUVECs. Indeed, CAD-LB reported the same ICAM-1 expression relationship as ICC methods identifying approximately 28% and 4% ICAM-1+ EVs in stimulated and unstimulated HUVEC conditioned media samples, respectively (Figure 2C). Compared to cellular changes, the EV compartment was altered to a lesser degree with stimulated HUVEC-derived EVs presenting 7.5-fold higher ICAM-1 expression.
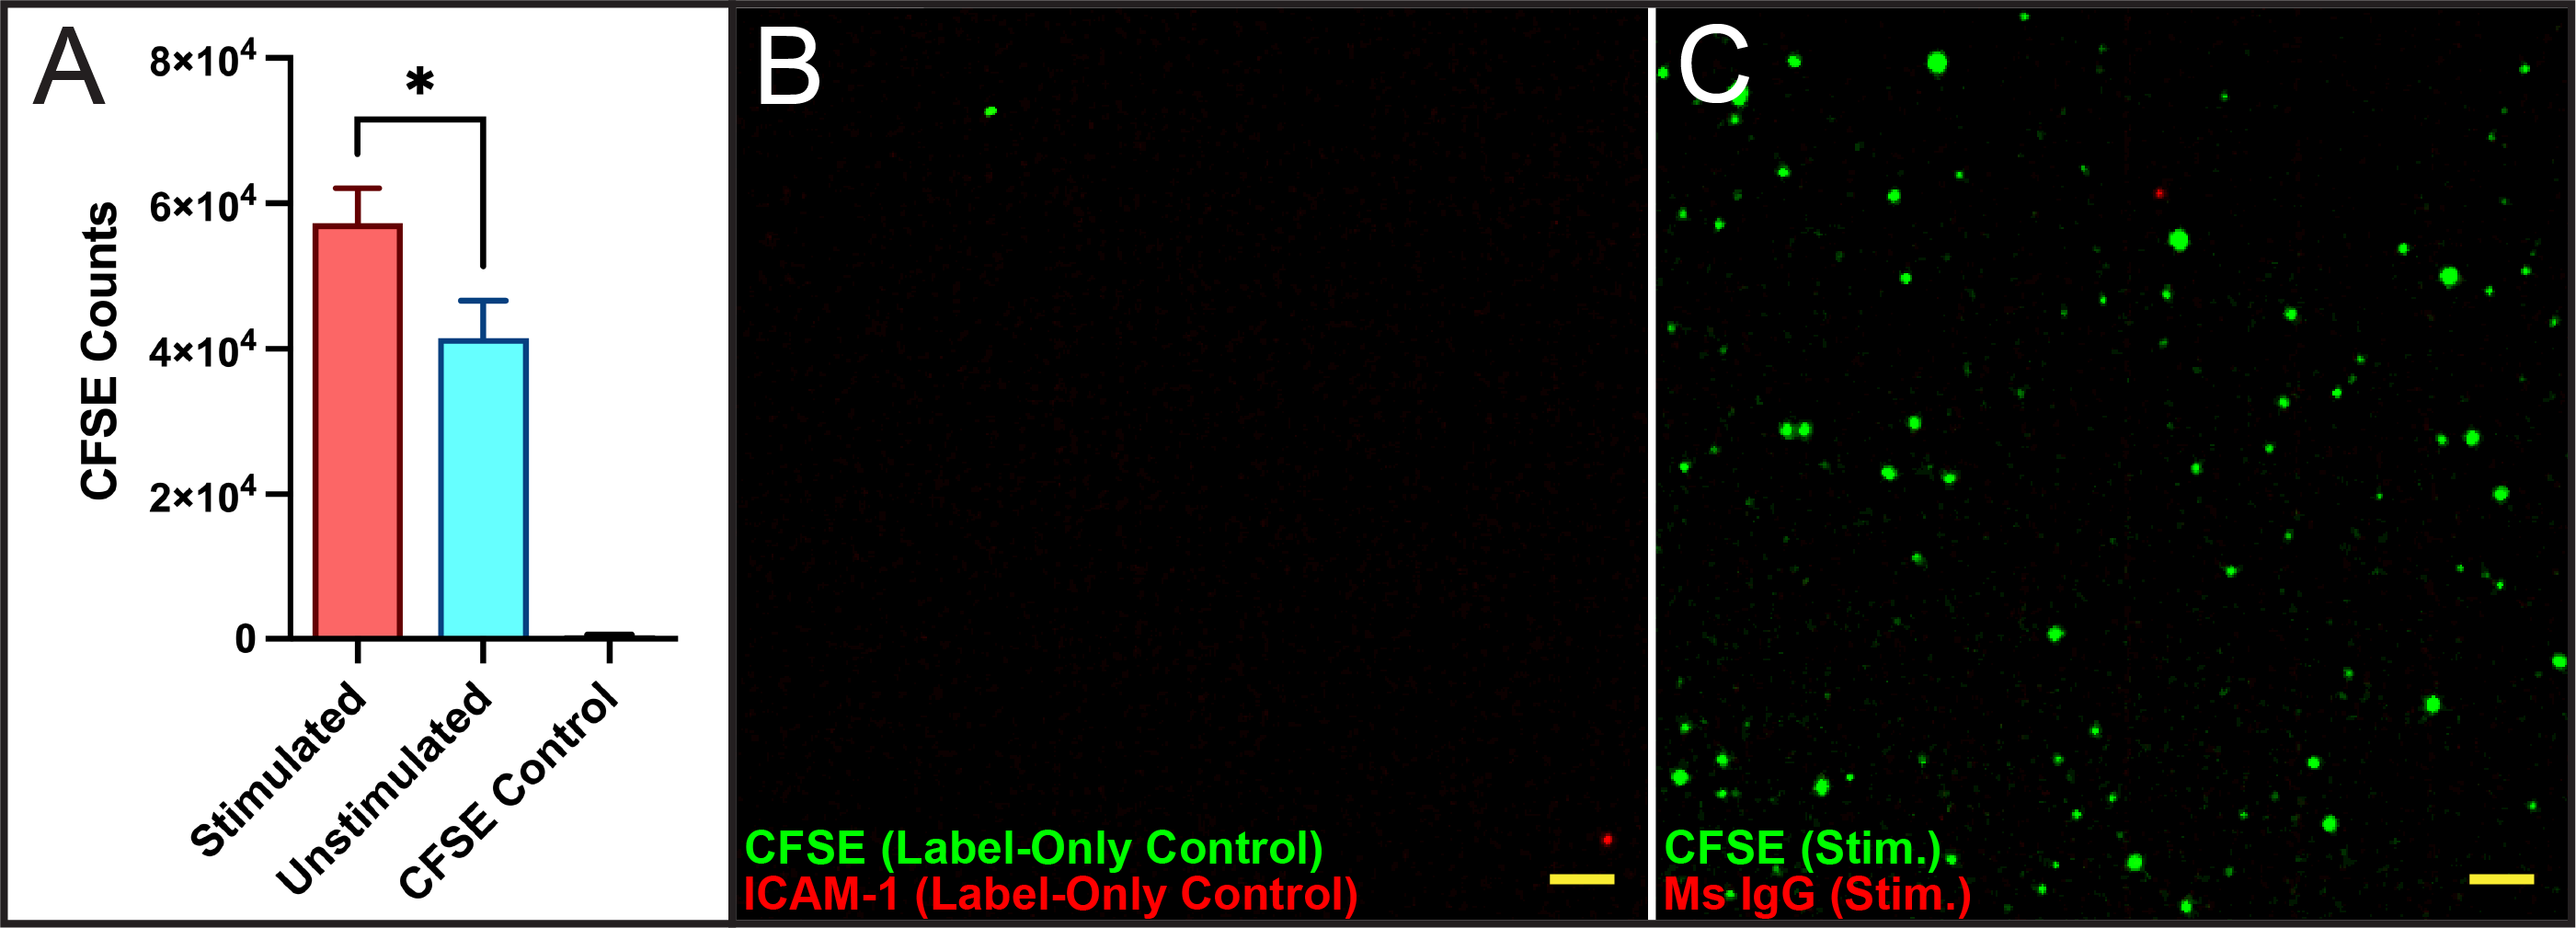
These experiments validate CAD-LB biomarker detection and should instill confidence in the platform. Furthermore, stimulation model results provide evidence that CAD-LB can detect EV biomarkers that capture protein expression shifts and possibly functional changes in parent cells. The detection of ICAM-1+ EVs following HUVEC stimulation is a phenomenon that has been previously reported in literature and carefully verified [1]. The finding that stimulation increases EV concentration in conditioned media is also in accordance with published results; both CAD-LB and NTA [1] report similar fold increases in EV concentration following TNF-α treatment. These experiments also highlight an advantage of CAD-LB, namely, the ability to process nonpurified EV samples. With minimal sample preparation and low EV input requirements (104) CAD-LB can provide a rapid and accurate assessment of EV biomarkers.
References
[1] Hosseinkhani, B., et al., Direct detection of nano-scale extracellular vesicles derived from inflammation-triggered endothelial cells using surface plasmon resonance. Nanomedicine, 2017. 13(5): p. 1663-1671.