Urea Clearance of Liftoff Device
Introduction
These results are thanks to assistance from Sam Walker and his previous posts regarding urea clearance that helped lay the foundation of this experiment.
“Single Slot Inverted-Chip and Double Slot: Single-Pass Dialysis Devices” (Walker 2018)
https://trace-bmps.org/single-slot-inverted-chip-and-double-slot-single-pass-dialysis-devices/
More information on the Liftoff membranes can be found in the article cited below:
“Lift-off of large-scale ultrathin nanomembranes” (Joshua J Miller et al 2015 J. Micromech. Microeng.)
https://iopscience.iop.org/article/10.1088/0960-1317/25/1/015011/pdf
Methods
The nanomembranes used in this experiment are encased in fully-bonded liftoff devices with an assumed pore size of 350 nm (Fig. 1). These liftoff devices also possess bonded entry tubing into the top and bottom channels where I attached additional tubing to connect to the syringes.


Figure 1). Side and top-down view of liftoff device containing the 350 nm nanomembrane as well as entry tubing to the top and bottom channels.
Prior to the urea clearance experiment, Dr. Johnson and I found it fit to determine the viability of a liftoff device before performing further tests. This was done via a leak test using food coloring to observe if it bled through the membrane or not. First, the device was primed by pushing 1x PBS into both channels until full saturation was reached. Then, three drops of green food coloring were mixed with 50 mL of diH2O in a sterile conical tube. Using syringe pumps, two 5 mL syringes pushed concurrently at a rate of 100 uL/min, with green diH2O in the top channel and clear diH2O in the bottom (Fig. 2). Both exit tubes led to waste containers. The device passed the leak test if no green was found in the bottom channel waste container after 30 min.

Figure 2). Top-down view of the leak test experimental set-up.
After a successful leak test, the liftoff device was deemed viable to participate in the urea clearance test. Before each repetition, the device was cleaned and re-primed by pushing 1x PBS through both channels until complete clearing of remnants was certain. For the urea clearance experiment, a 50 mmol urea spiked 1x PBS solution was made (150 mg in 50 mL 1x PBS). In this case, two syringes filled with the urea solution analyte and the 1x PBS dialysate were pushed through the device at a rate of 10 uL/min and 20 uL/min, respectively, in a counterflow manner (Fig. 3). Similar to the leak test set-up, the outputs of both channels were raised to approximately the same height to minimize pressure differences between channels. The samples were collected using a fraction collector timed to change sample tubes every hour, after which the previously completed sample was immediately stored in 4℃ for the following urea assay. Fractionation was conducted in triplicates, but due to the time taken for each repetition, the experiment was performed over two days. Between days one and two, the device was filled with 1x PBS and stored at 4℃ overnight (~12 hours).
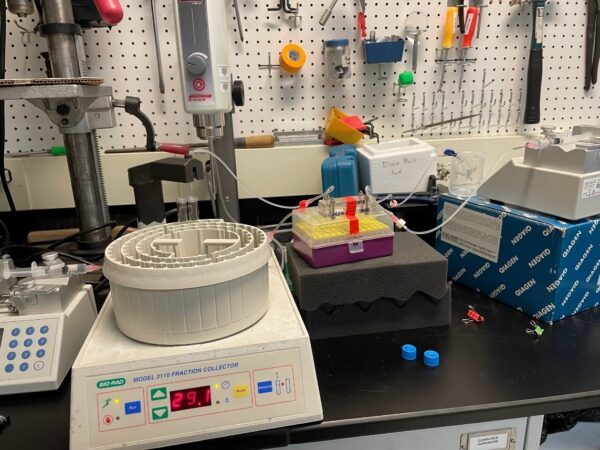
Figure 3). Urea clearance experimental set-up.
As previously mentioned, immediately after collection, each sample was stored at 4℃ for the following urea assay. The assay took place three days after the final replication. The assay took place using a 96-well plate with room to prepare a standardization curve as well as duplicates of each hour of each triplicate to minimize the effects of human error. The standard curve was created by generating six wells of 0, 20, 40, 80, and 100 nmol using the urea standard with an adjusted volume of 50 uL/well with dH2O. For the experimental samples, 1 uL was added per well and then adjusted to a volume of 50 uL/well with dH2O. The reaction mix was made following the procedure, and 200 uL of the mix was added to each well. Samples were subsequently assayed, obtaining absorbance data at 505 nm.
I then measured the fluid output of both channels of the used liftoff device and one not used for this experiment within a similar time frame. In the same experimental set-up as previously shown, urea spiked 1x PBS and 1x PBS were pushed counter to each other for an hour at the rates mentioned earlier. The output for the top and bottom channels in both devices was seen to hold a 3/2 ratio respectively after 1 hour. This suggests that fluids did not cross the membrane in a manner that may affect filtration or the results of the urea assay.
Results
The results for utilizing the 350 nm liftoff devices for urea clearance show a quick loss of urea, followed by an asymptotic run-off. This experiment reached a maximum of approximately 57% clearance at 4 hours (Fig 4). This may not be the optimal maximum that can be achieved with these devices, and with the foundation set with this test, we may be able to see significant improvement with some minor modifications.
![]()
Figure 4). Urea clearance data over a time course of four hours. Results represent the percentage of urea cleared from the analyte. The 50 mM spiked 1x PBS analyte and 1x PBS dialysate ran counterflow at rates of 10 uL/min and 20 uL/min respectively.