Here, I will post figure drafts for the paper that introduces the modular µSiM (m-µSiM).
Figures
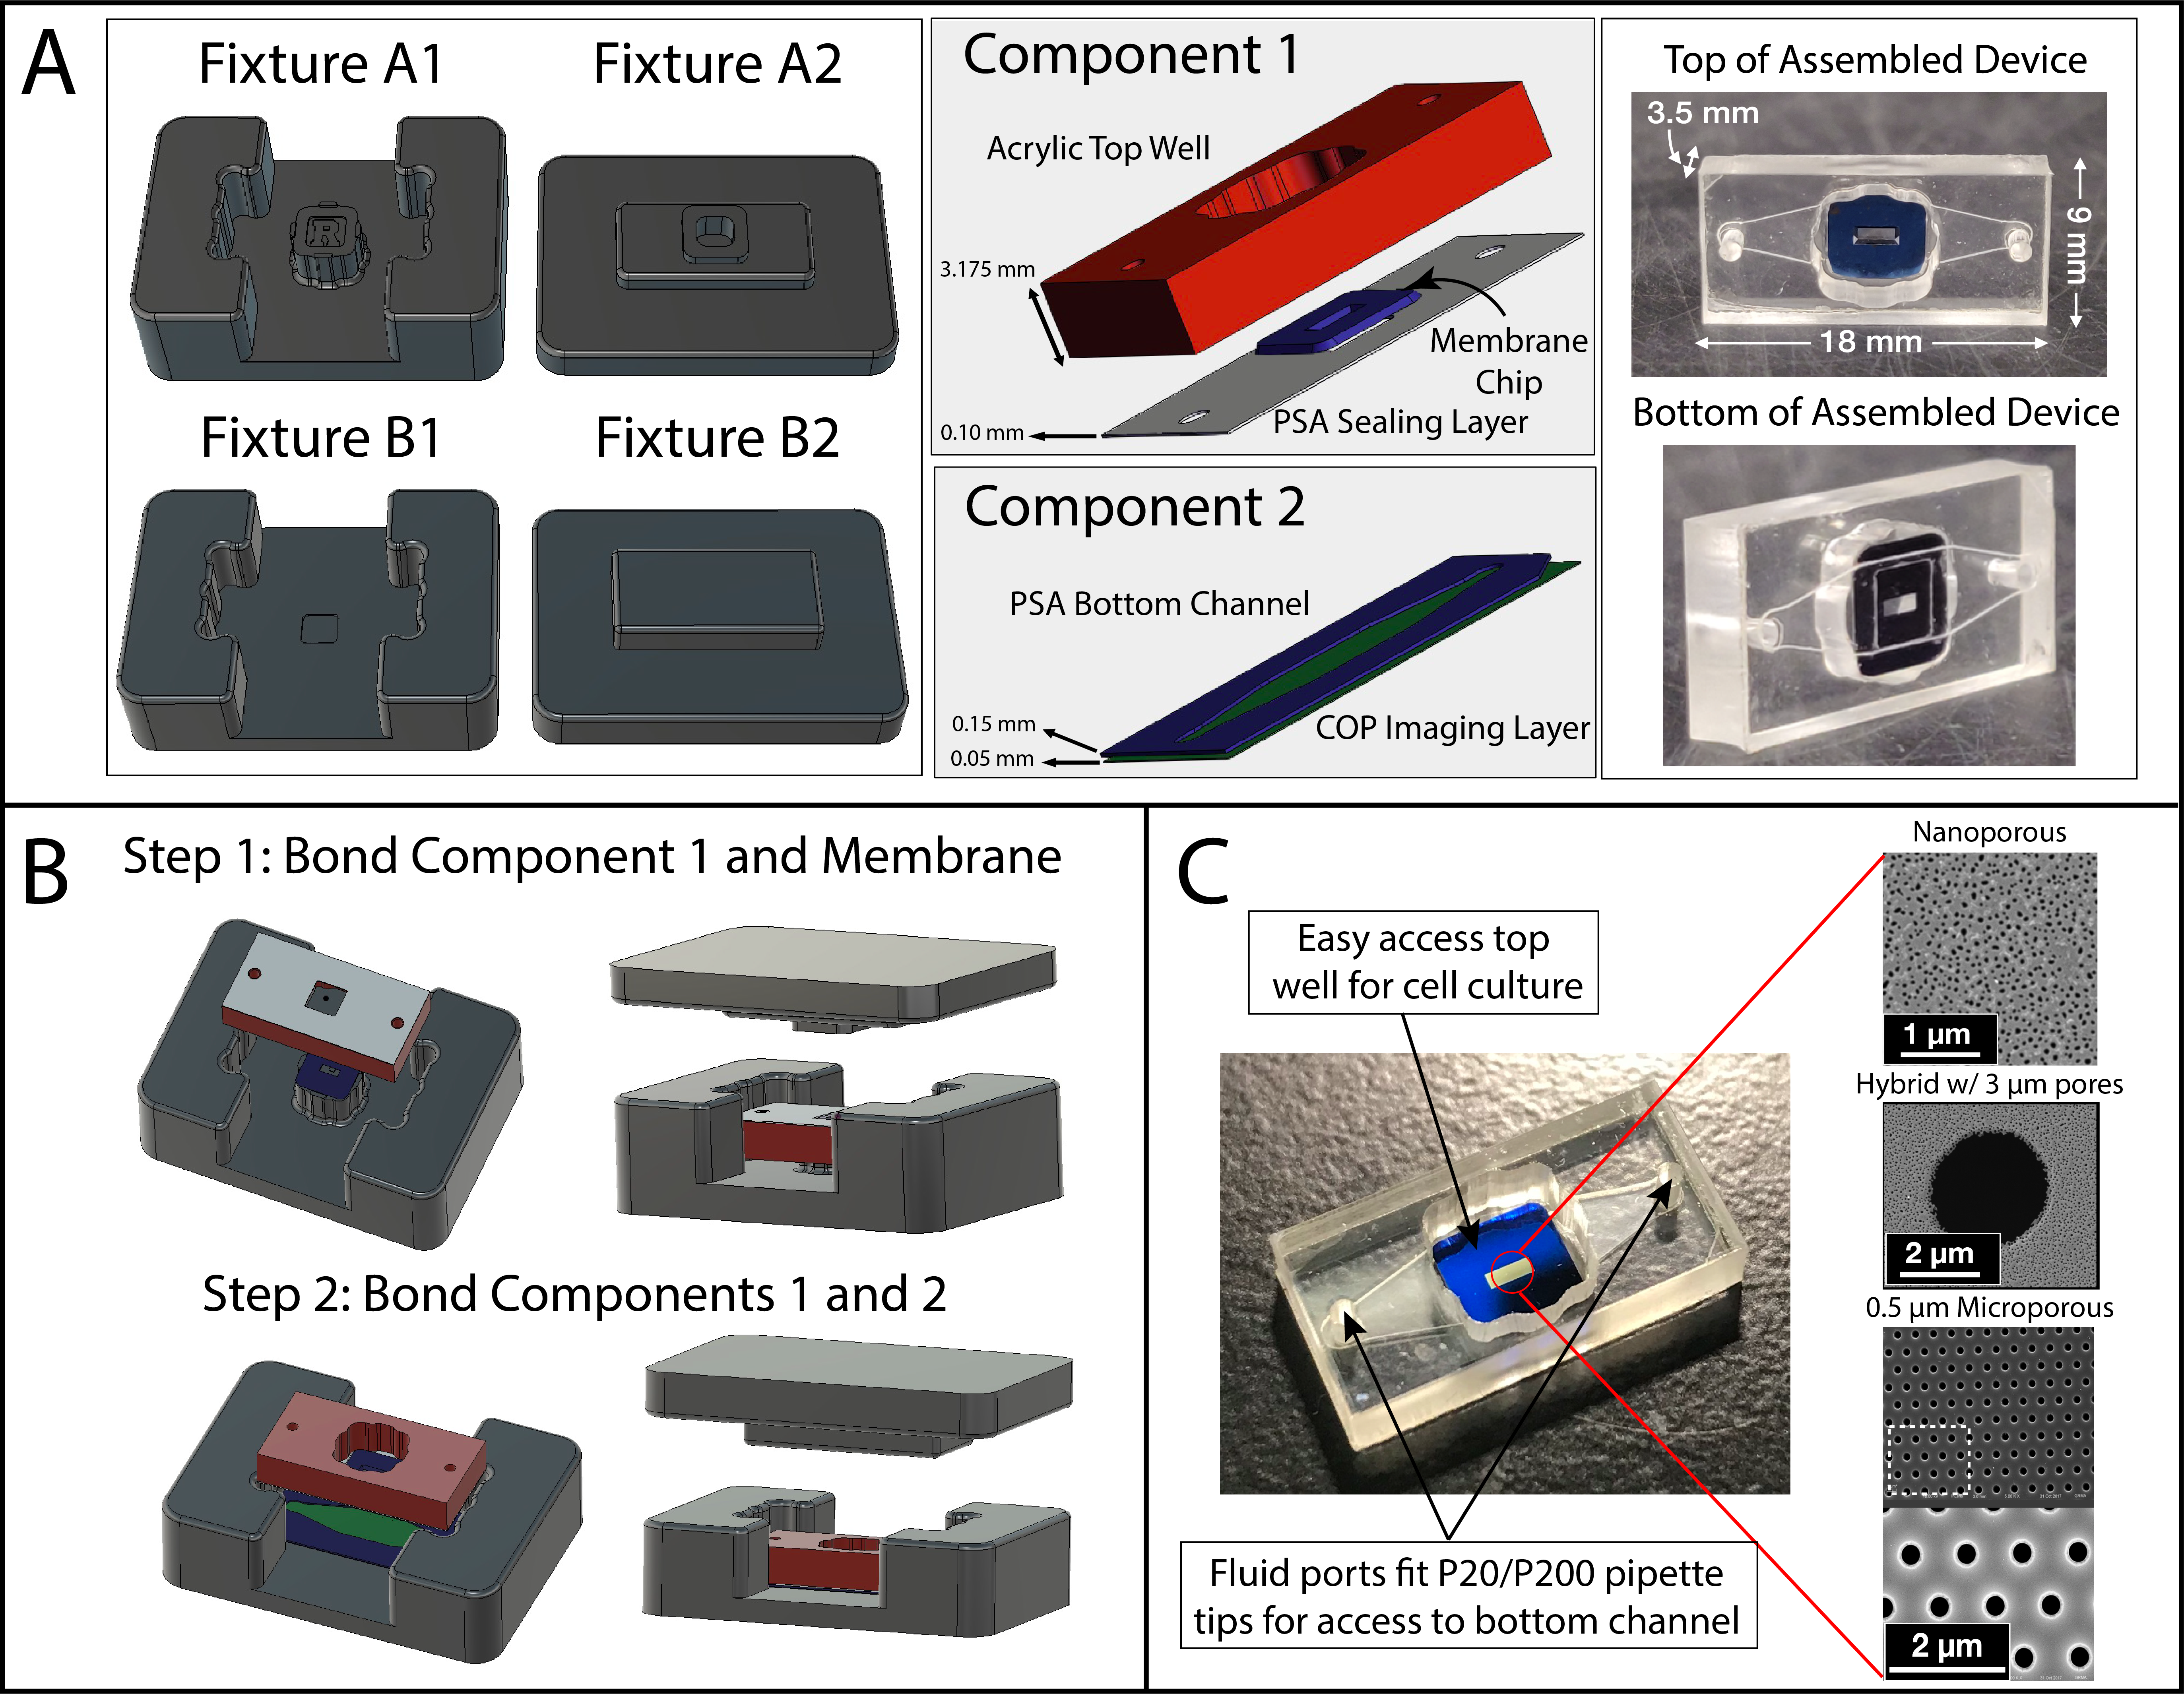
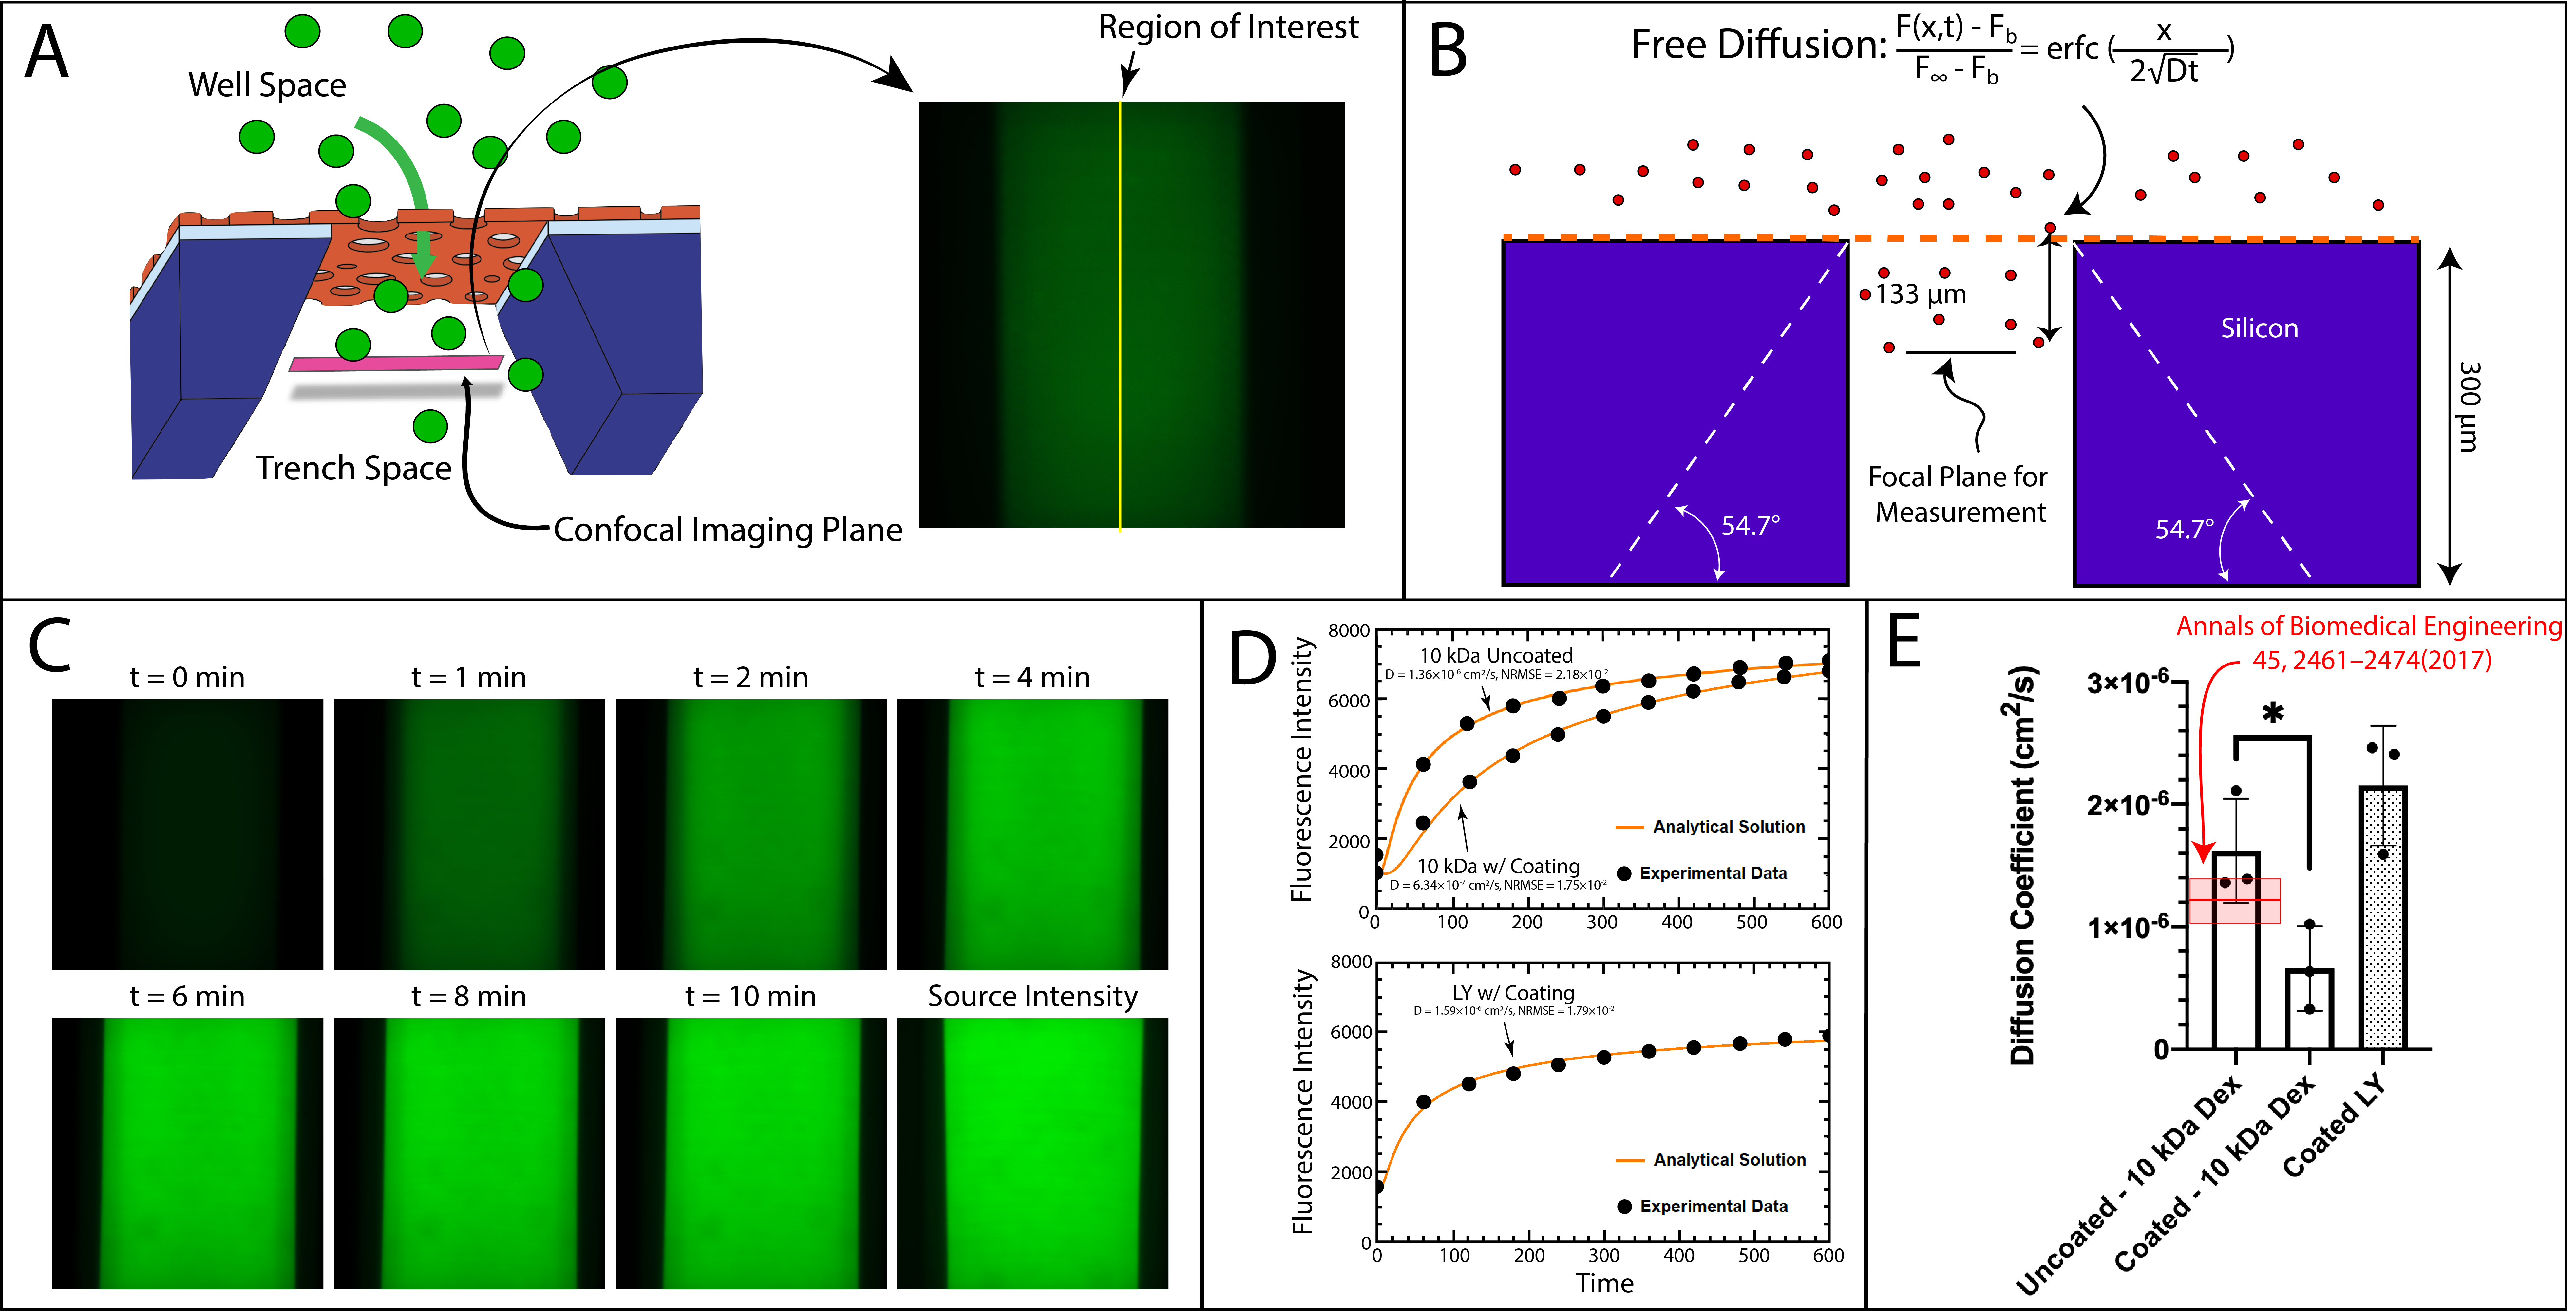
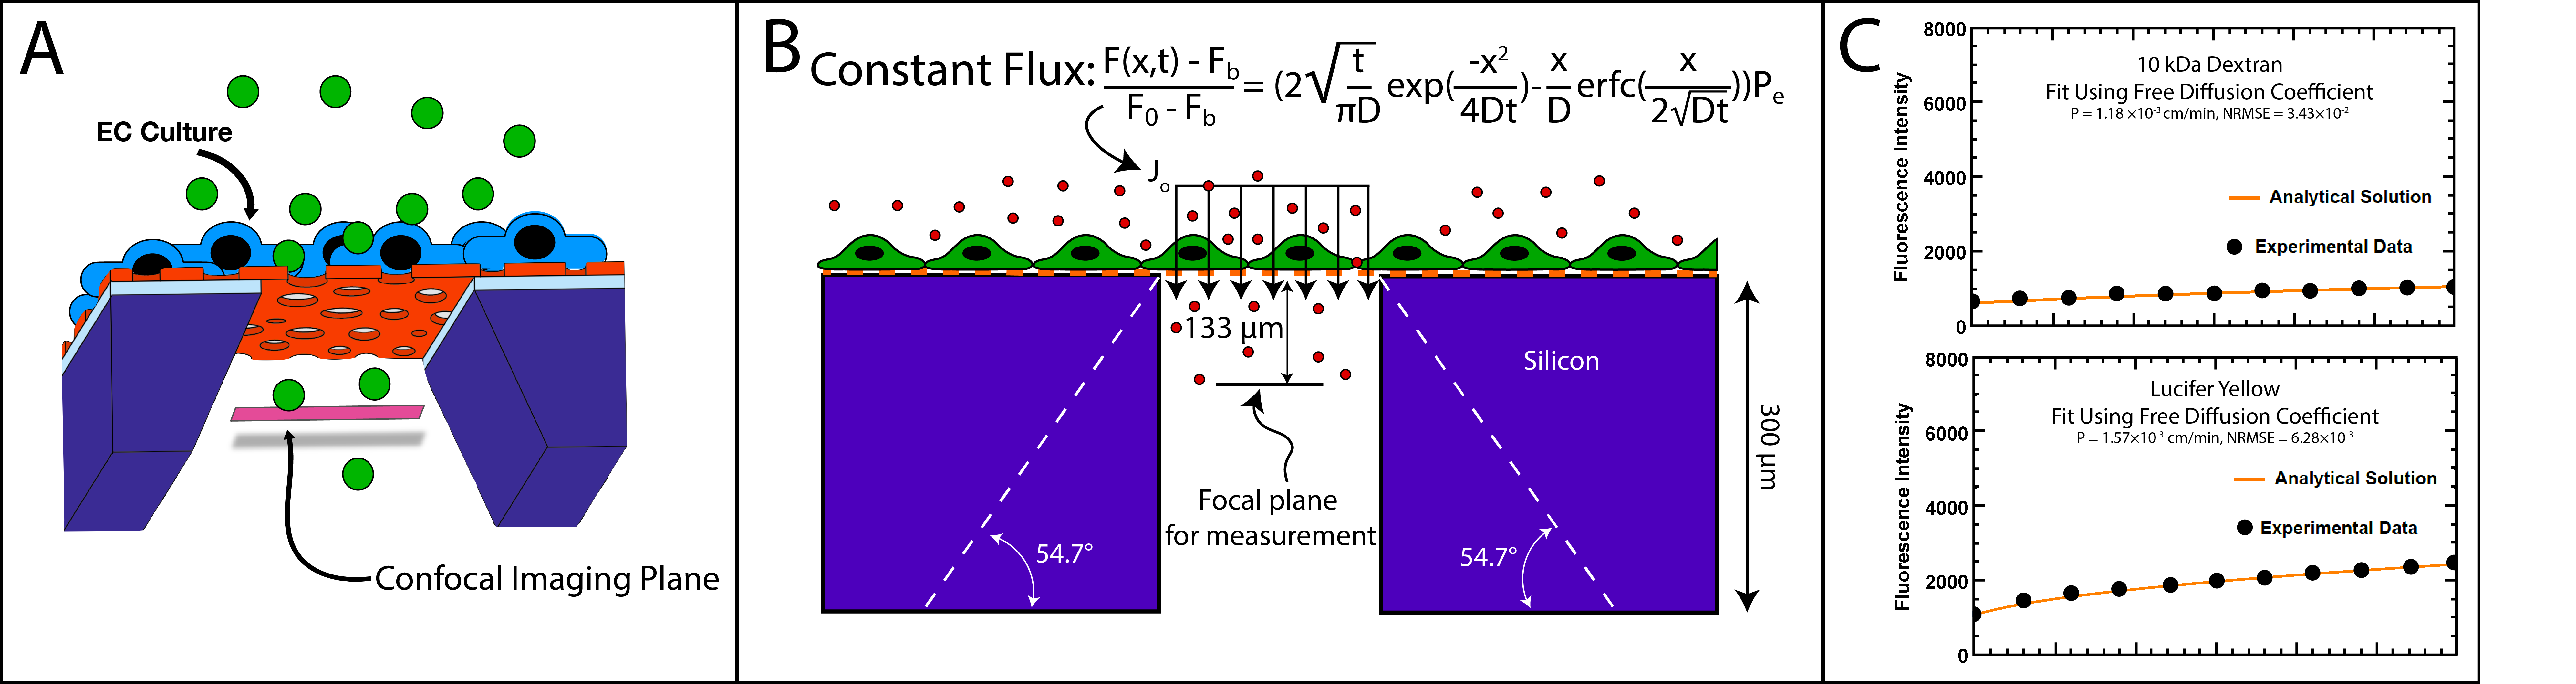
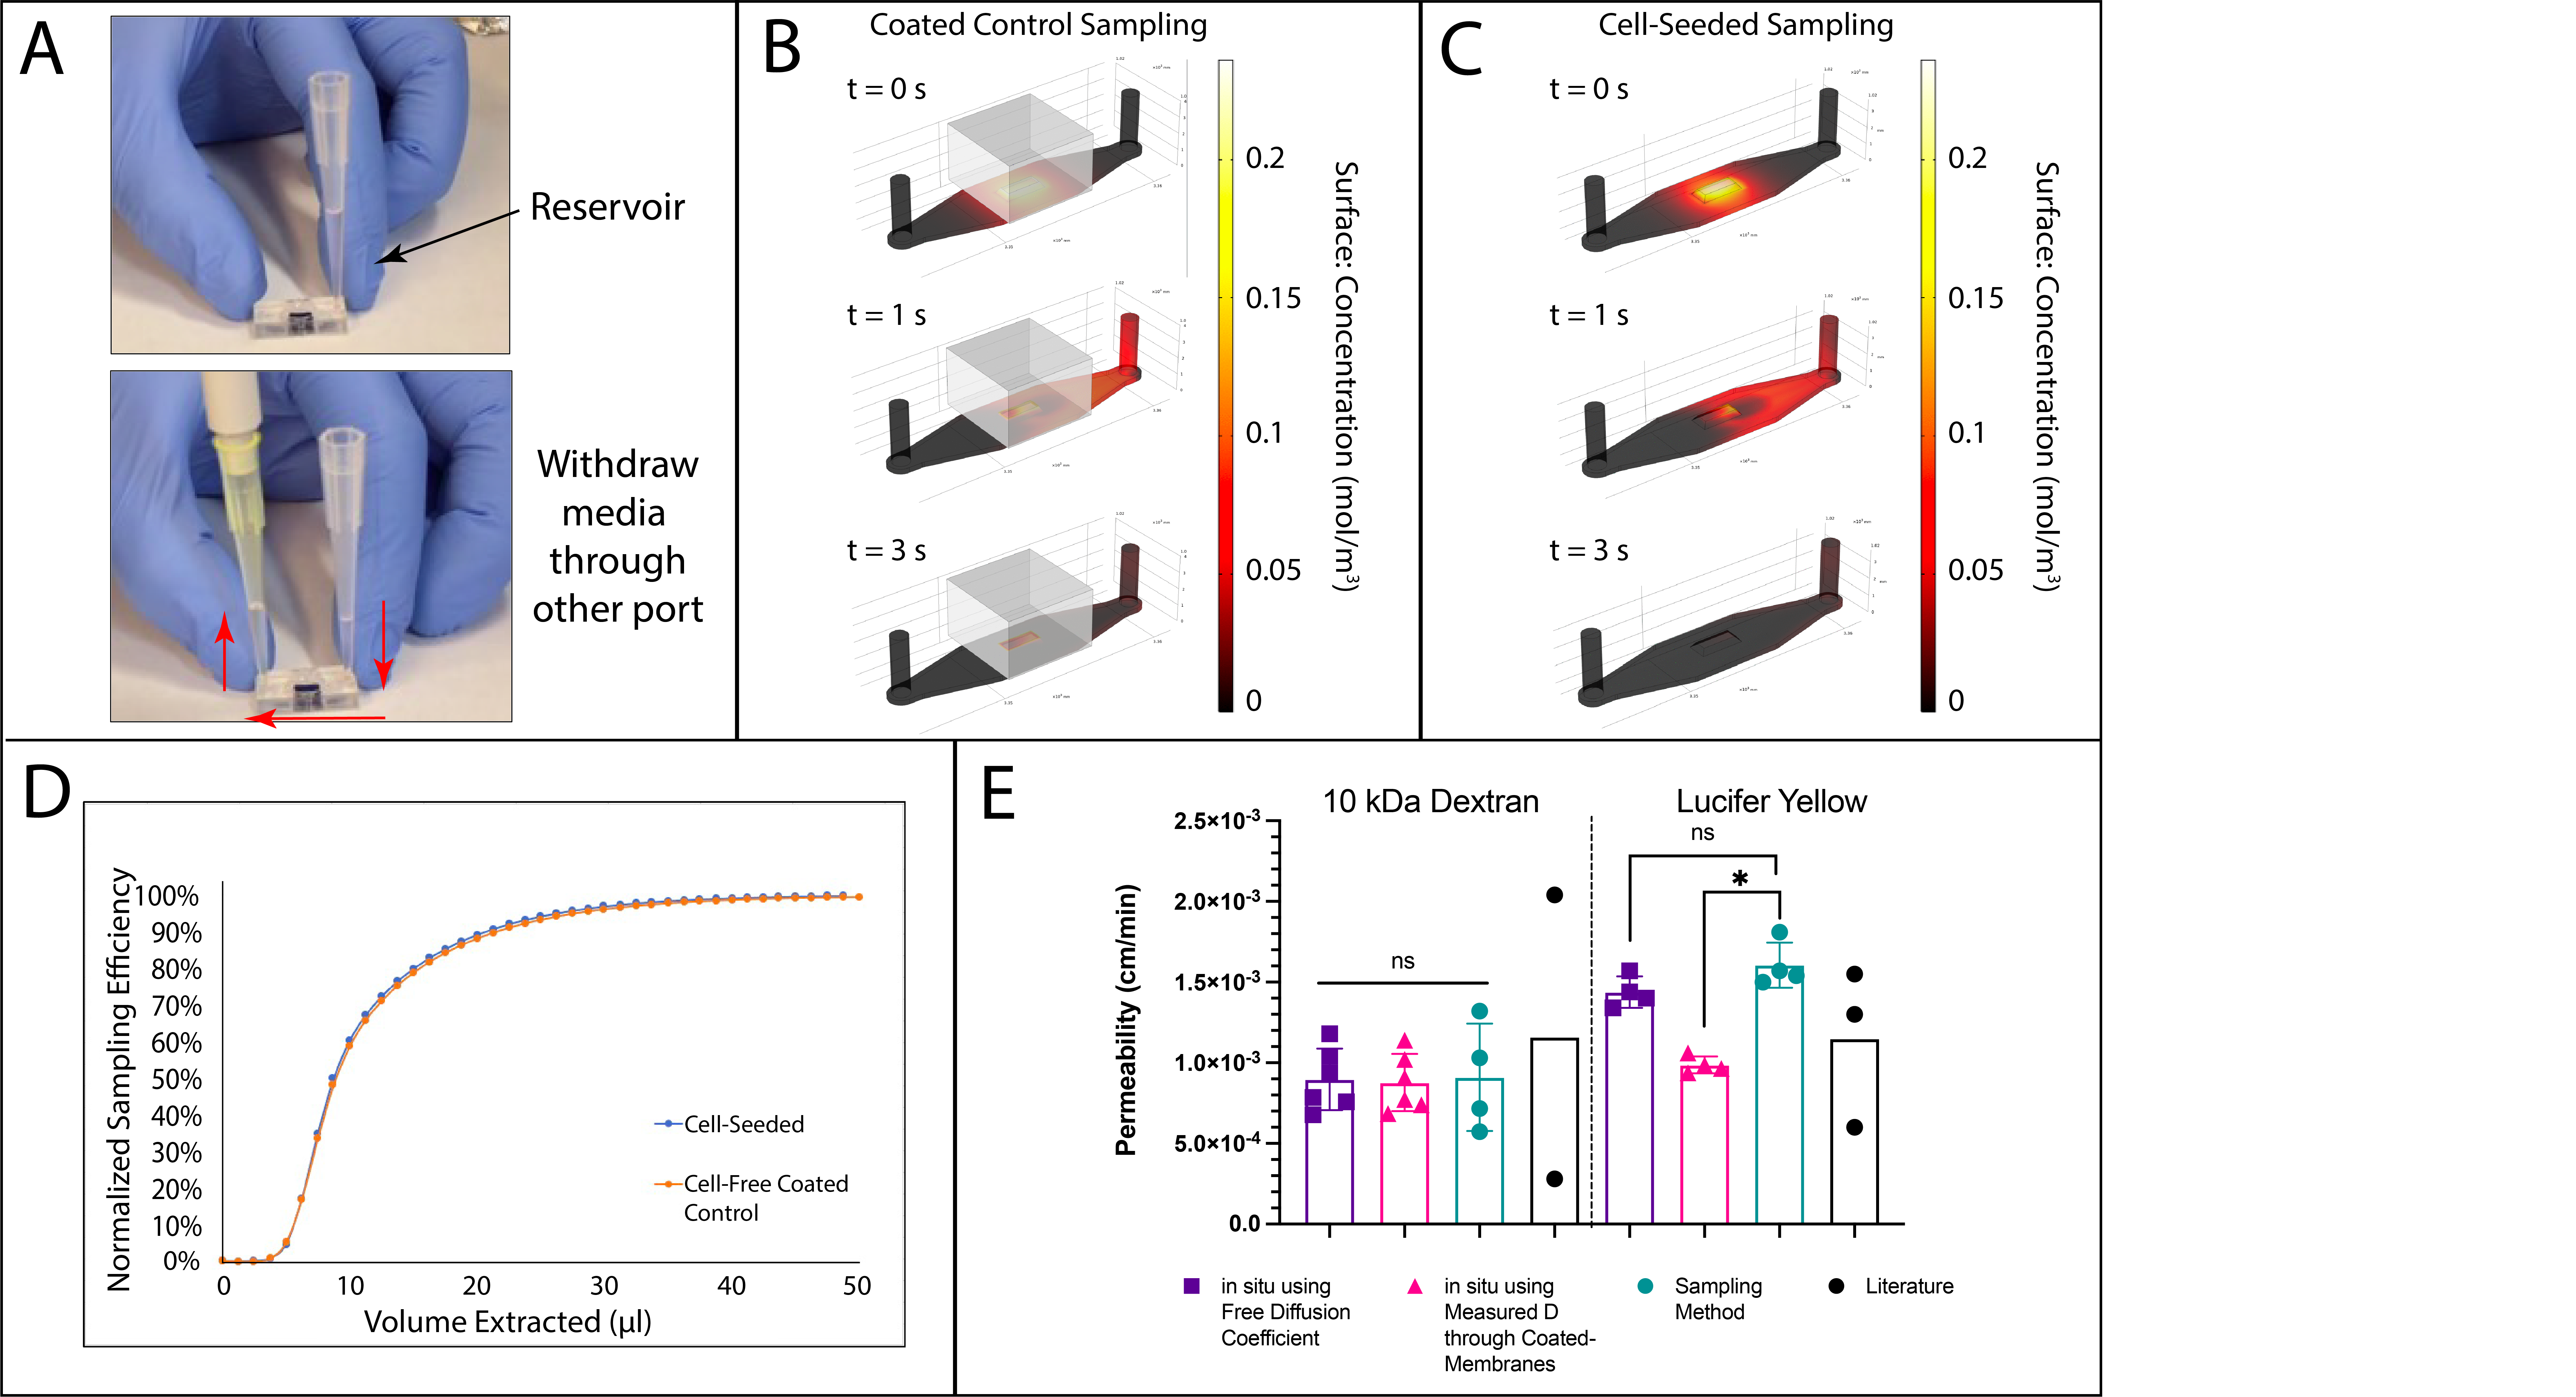
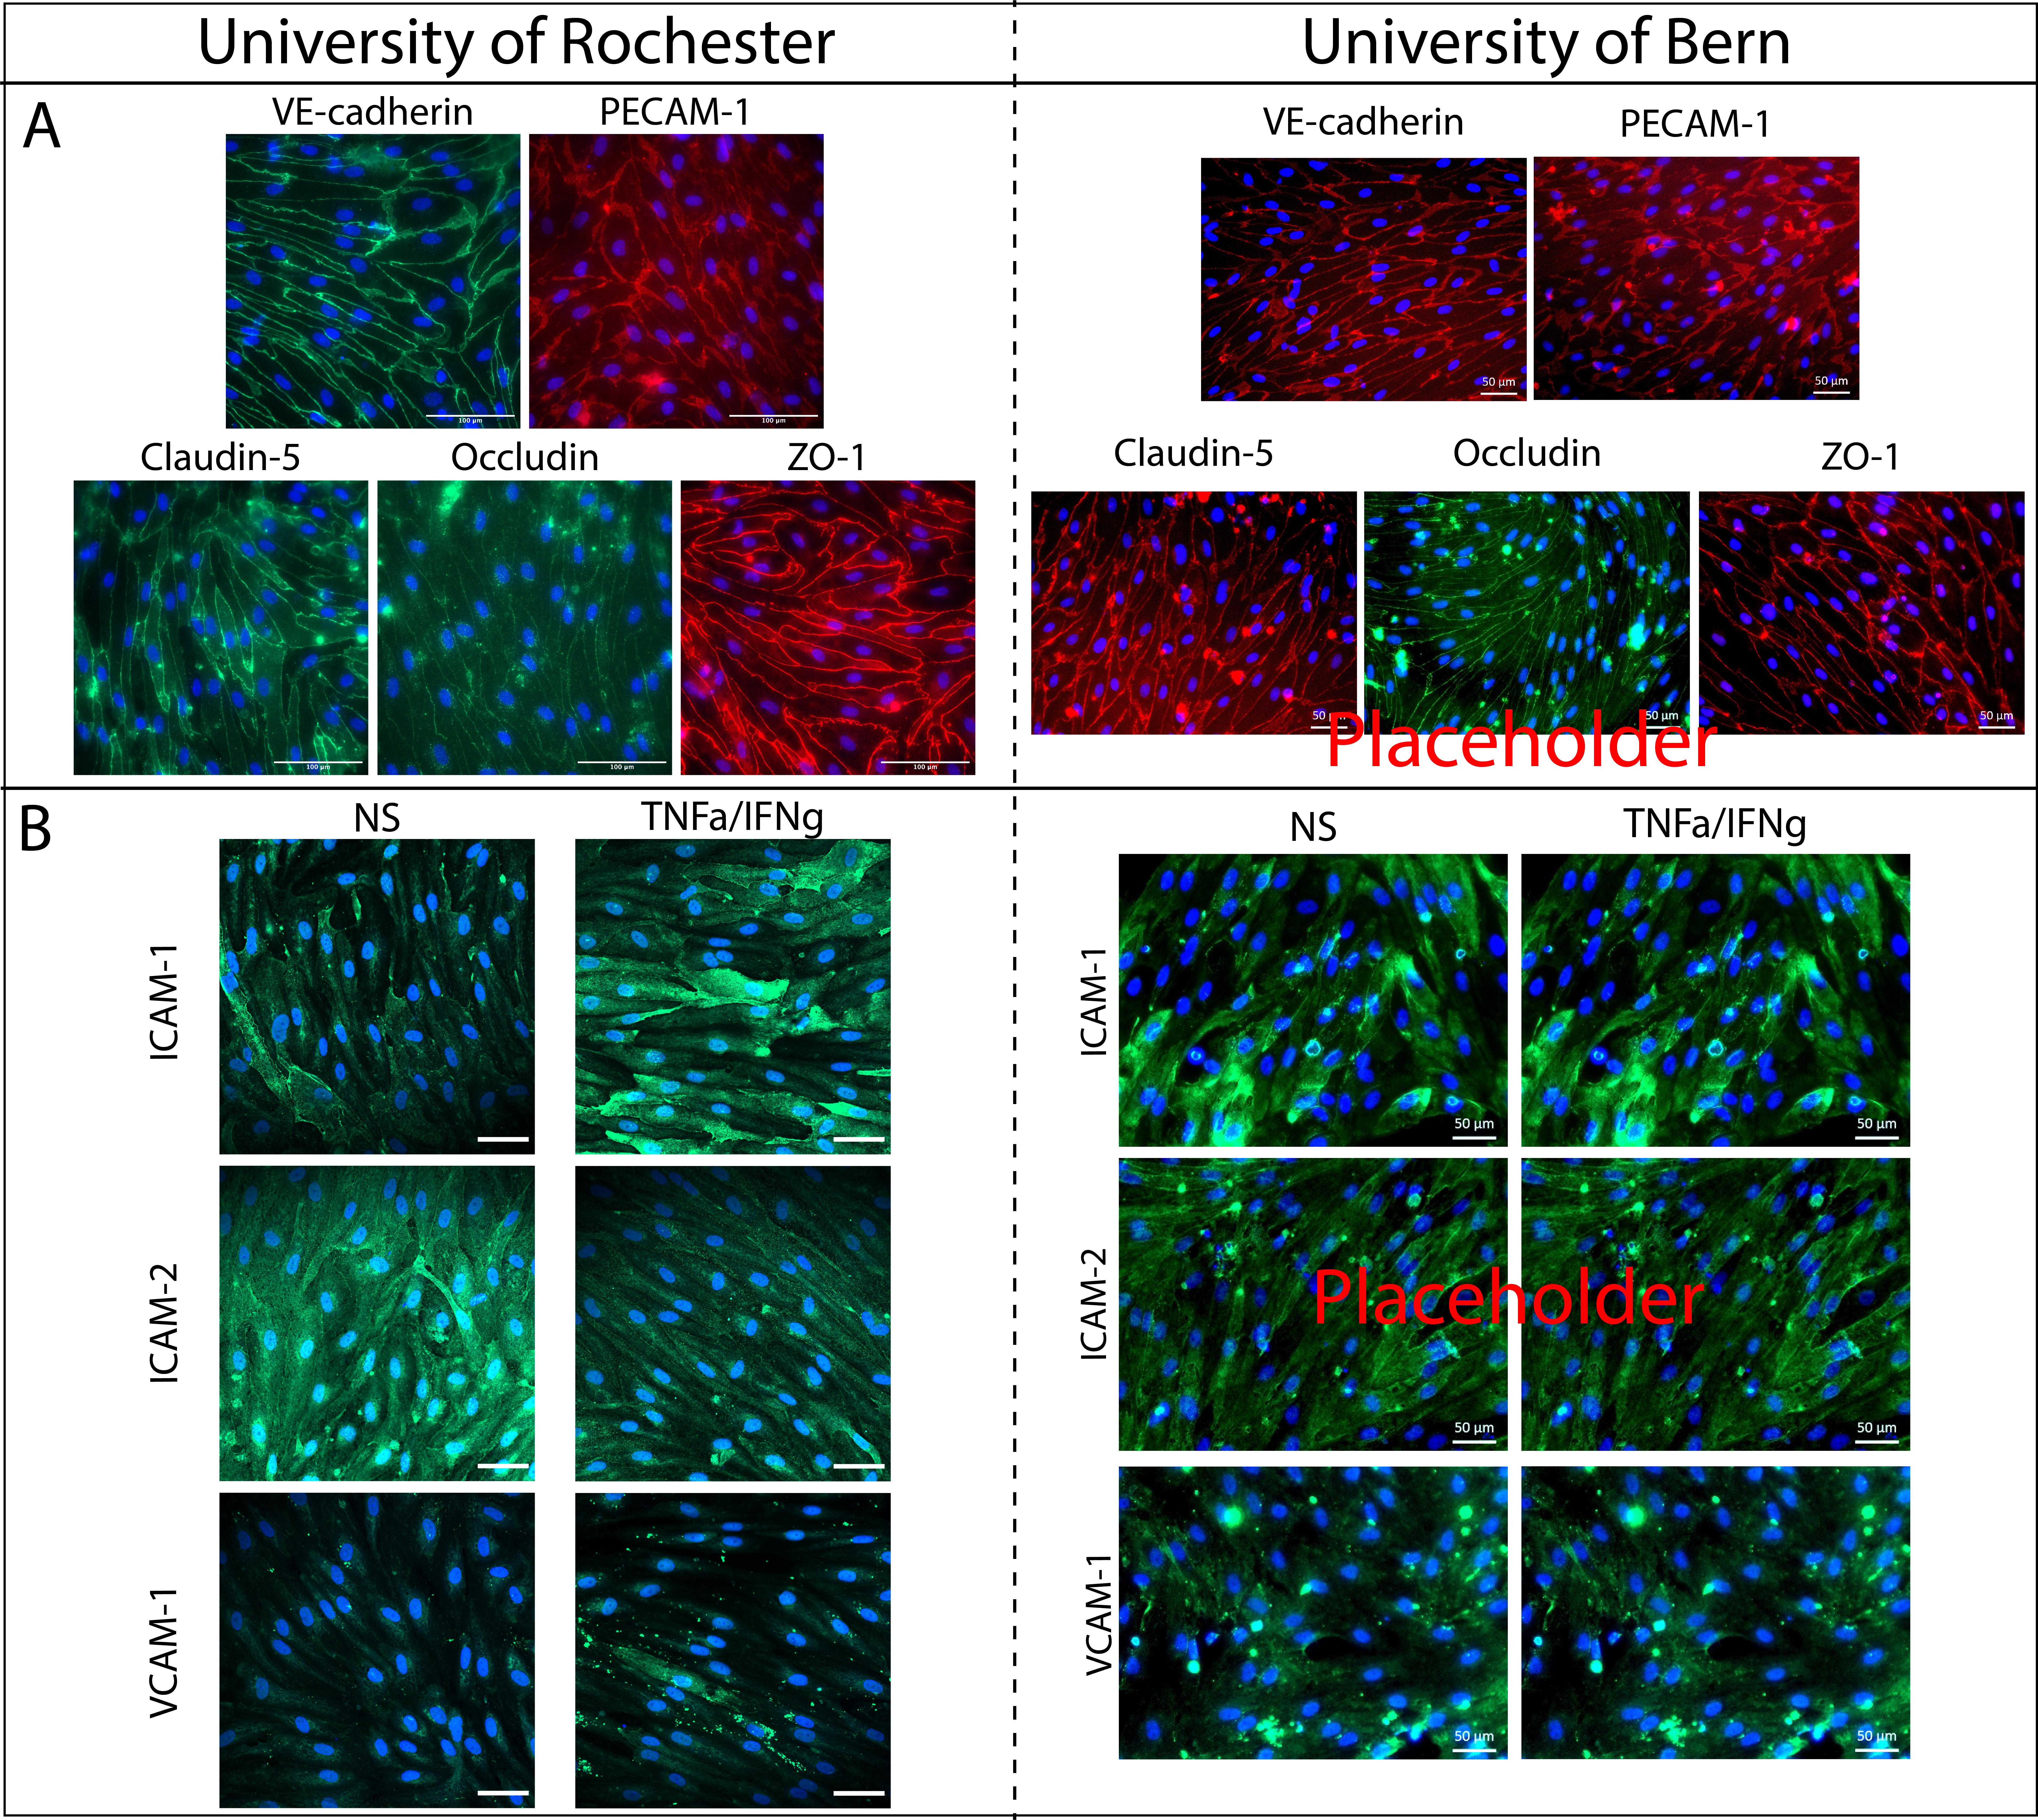
Fig. 1. m-µSiM Assembly. (A) Fixtures are used to guide components and membrane together. Component 1 is composed of an acrylic top layer with a TranswellTM-style open well and a PSA sealing layer. Component 2 is composed of a thin, PSA bottom channel and COP imaging layer. (B) Assembly is a two-step process. Step 1: Bond component 1 and membrane. Place membrane on fixture A1 pedestal. Place component 1 face down over membrane. Use fixture A2 to press firmly and activate PSA. This irreversibly bonds membrane to component 1. Step 2: Bond components 1 and 2. Place component 2 in fixture B1, channel-side up. Place component 1 with membrane onto component 2. Use fixture B2 to press firmly to activate PSA, irreversibly bonding component 1 and component 2. (C) The modular assembly allows different style membranes to readily be selected for the application at hand. Component 1’s open well format allows easy cell culture, and access ports provide access to the bottom channel. They are designed to seal-to-fit standard P20 and P200 pipet tips.Fig. 2. in situ permeability assay optimization on cell-free devices. (A) A confocal microscope is focused 133 µm below the membrane, within the chip’s trench. Dye diffuses from the well into the trench (left). Example of corresponding image (right) highlights region of interest, where 1-D diffusion occurs and fluorescence measurements are taken (yellow line). (B) Diffusion coefficients can be solved using a Fick’s Law-derived equation, modeling 1-D diffusion. This equation assumes there is no widening of trench walls with this model. (C) Dye can be seen diffusing into the trench over the course of ten minutes. Images are of 10 kDa Dextran-AF488 diffusing across a blank NPSN membrane chip. (D) Example plots of diffusion across uncoated and coated chips using 10 kDa Dextran-AF488 (top) and lucifer yellow (LY, bottom). The analytical solutions fit well the the experimental data. The resulting diffusion coefficient from the analytical solutions for 10 kDa Dex-AF488 across an uncoated membrane are in statistical agreement with the literature. Coating the membrane significantly decreases the apparent diffusion coefficient, whereas larger apparent diffusion coefficients are measured with smaller molecules. N = 3 per group. Students t-test, p < 0.05.Fig. 3. in situ permeability assay optimization using hCMEC/D3. (A) A confocal microscope is focused 133 µm below the membrane, within the chip’s trench. Dye diffuses from the well, across an endothelial cell layer, and into the trench (left). (B) Permeability can be solved using a constant flux model. (C) Example plots of the analytical solutions for permeability of 10 kDa Dex-FITC (top) and lucifer yellow (bottom) across an hCMEC/D3 monolayer using the free diffusion coefficient. The analytical solutions fit well the the experimental data.Fig. 4. Sampling permeability assay optimization and validation of assays. (A) Sampling method process for collecting dye from the channel. A reservoir is added to one port that access the channel, and another pipet is used to pull media across. Media withdrawn is added to a well plate for fluorescence measurements. (B) COMSOL was used to model the sampling process across coated-control devices (B) and cell-seeded devices (C). HOWARD BRIEF SENTENCE OF MODEL FOR DIFFUSION. (D) COMSOL model sampling efficiency of lucifer yellow for different volumes extracted from the channel. Sampling using a single 50 µl draw clears dye from the channel for both coated-control and cell-seeded devices. (E) hCMEC/D3 permeability to 10 kDa Dextran and luficer yellow experimentally determined using the in situ and sampling methods. The in situ method includes analysis using both the free diffusion coefficient and measured diffusion coefficient through coated-membranes. Permeability values found in the literature are included. N = 4-6 per group. Two-way ANOVA, p < 0.05.Fig. 5. Validation of m-µSiM distribution to non-engineering labs and replicability of data utilizing EECM-BMEC-like cell differentiation protocol. (A) EECM-BMEC-like cells express similar patterns of key junctional molecules when derived and cultured on m-µSiM devices at UR and UniBe. (B) EECM-BMEC-like cells upregulate expression of cell adhesion molecules upon exposure proinflammatory stimuli in a comparable manner when derived and cultured on m-µSiM devices at UR and UniBe.
Remaining data to obtain: Occludin staining in IMR90-4 from UniBe in µSiM. We have tried this after 2 day culture in µSiM, which worked at UR but is not working at UniBe.
Current problem: Occludin is not seen in junctions but in cytosol.
Solution A: Test longer culture time to give junctions time to mature.
Solution B: Use ReDup or do not show reproducibility for occludin in figure. Note difference in Supplement.
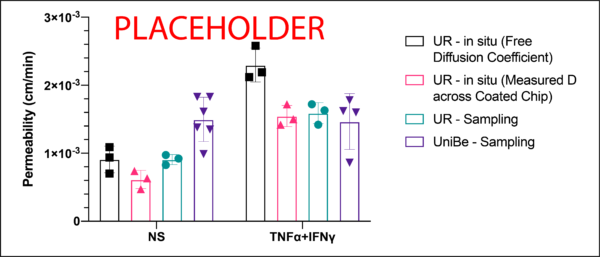
Fig. 6. EECM-BMEC baseline permeability and response to TNFa+IFNg treatment. EECM-BMEC-like cells demonstrate comparable baseline permeabilities between lab. Cells increase permeability in response to proinflammatory stimuli in a comparable manner when derived and cultured on m-µSiM devices at UR and UniBe.
Remaining data to obtain: Sampling permeability data of IMR90-4 from UniBe in µSiM. We have tried this after 2 day culture in µSiM, which worked at UR but is giving high baseline permeability at UniBe.
Current problem: Baseline permeability is too high at UniBe in µSiM and no response to cytokines. Same cells in transwells are fine.
Solution A: Test longer culture time to give junctions time to mature. Hopefully this will improve baseline permeability and we will now see response to cytokines.
Solution B: Use ReDup or HUVEC to show success of permeability assay in a non-engineering lab.
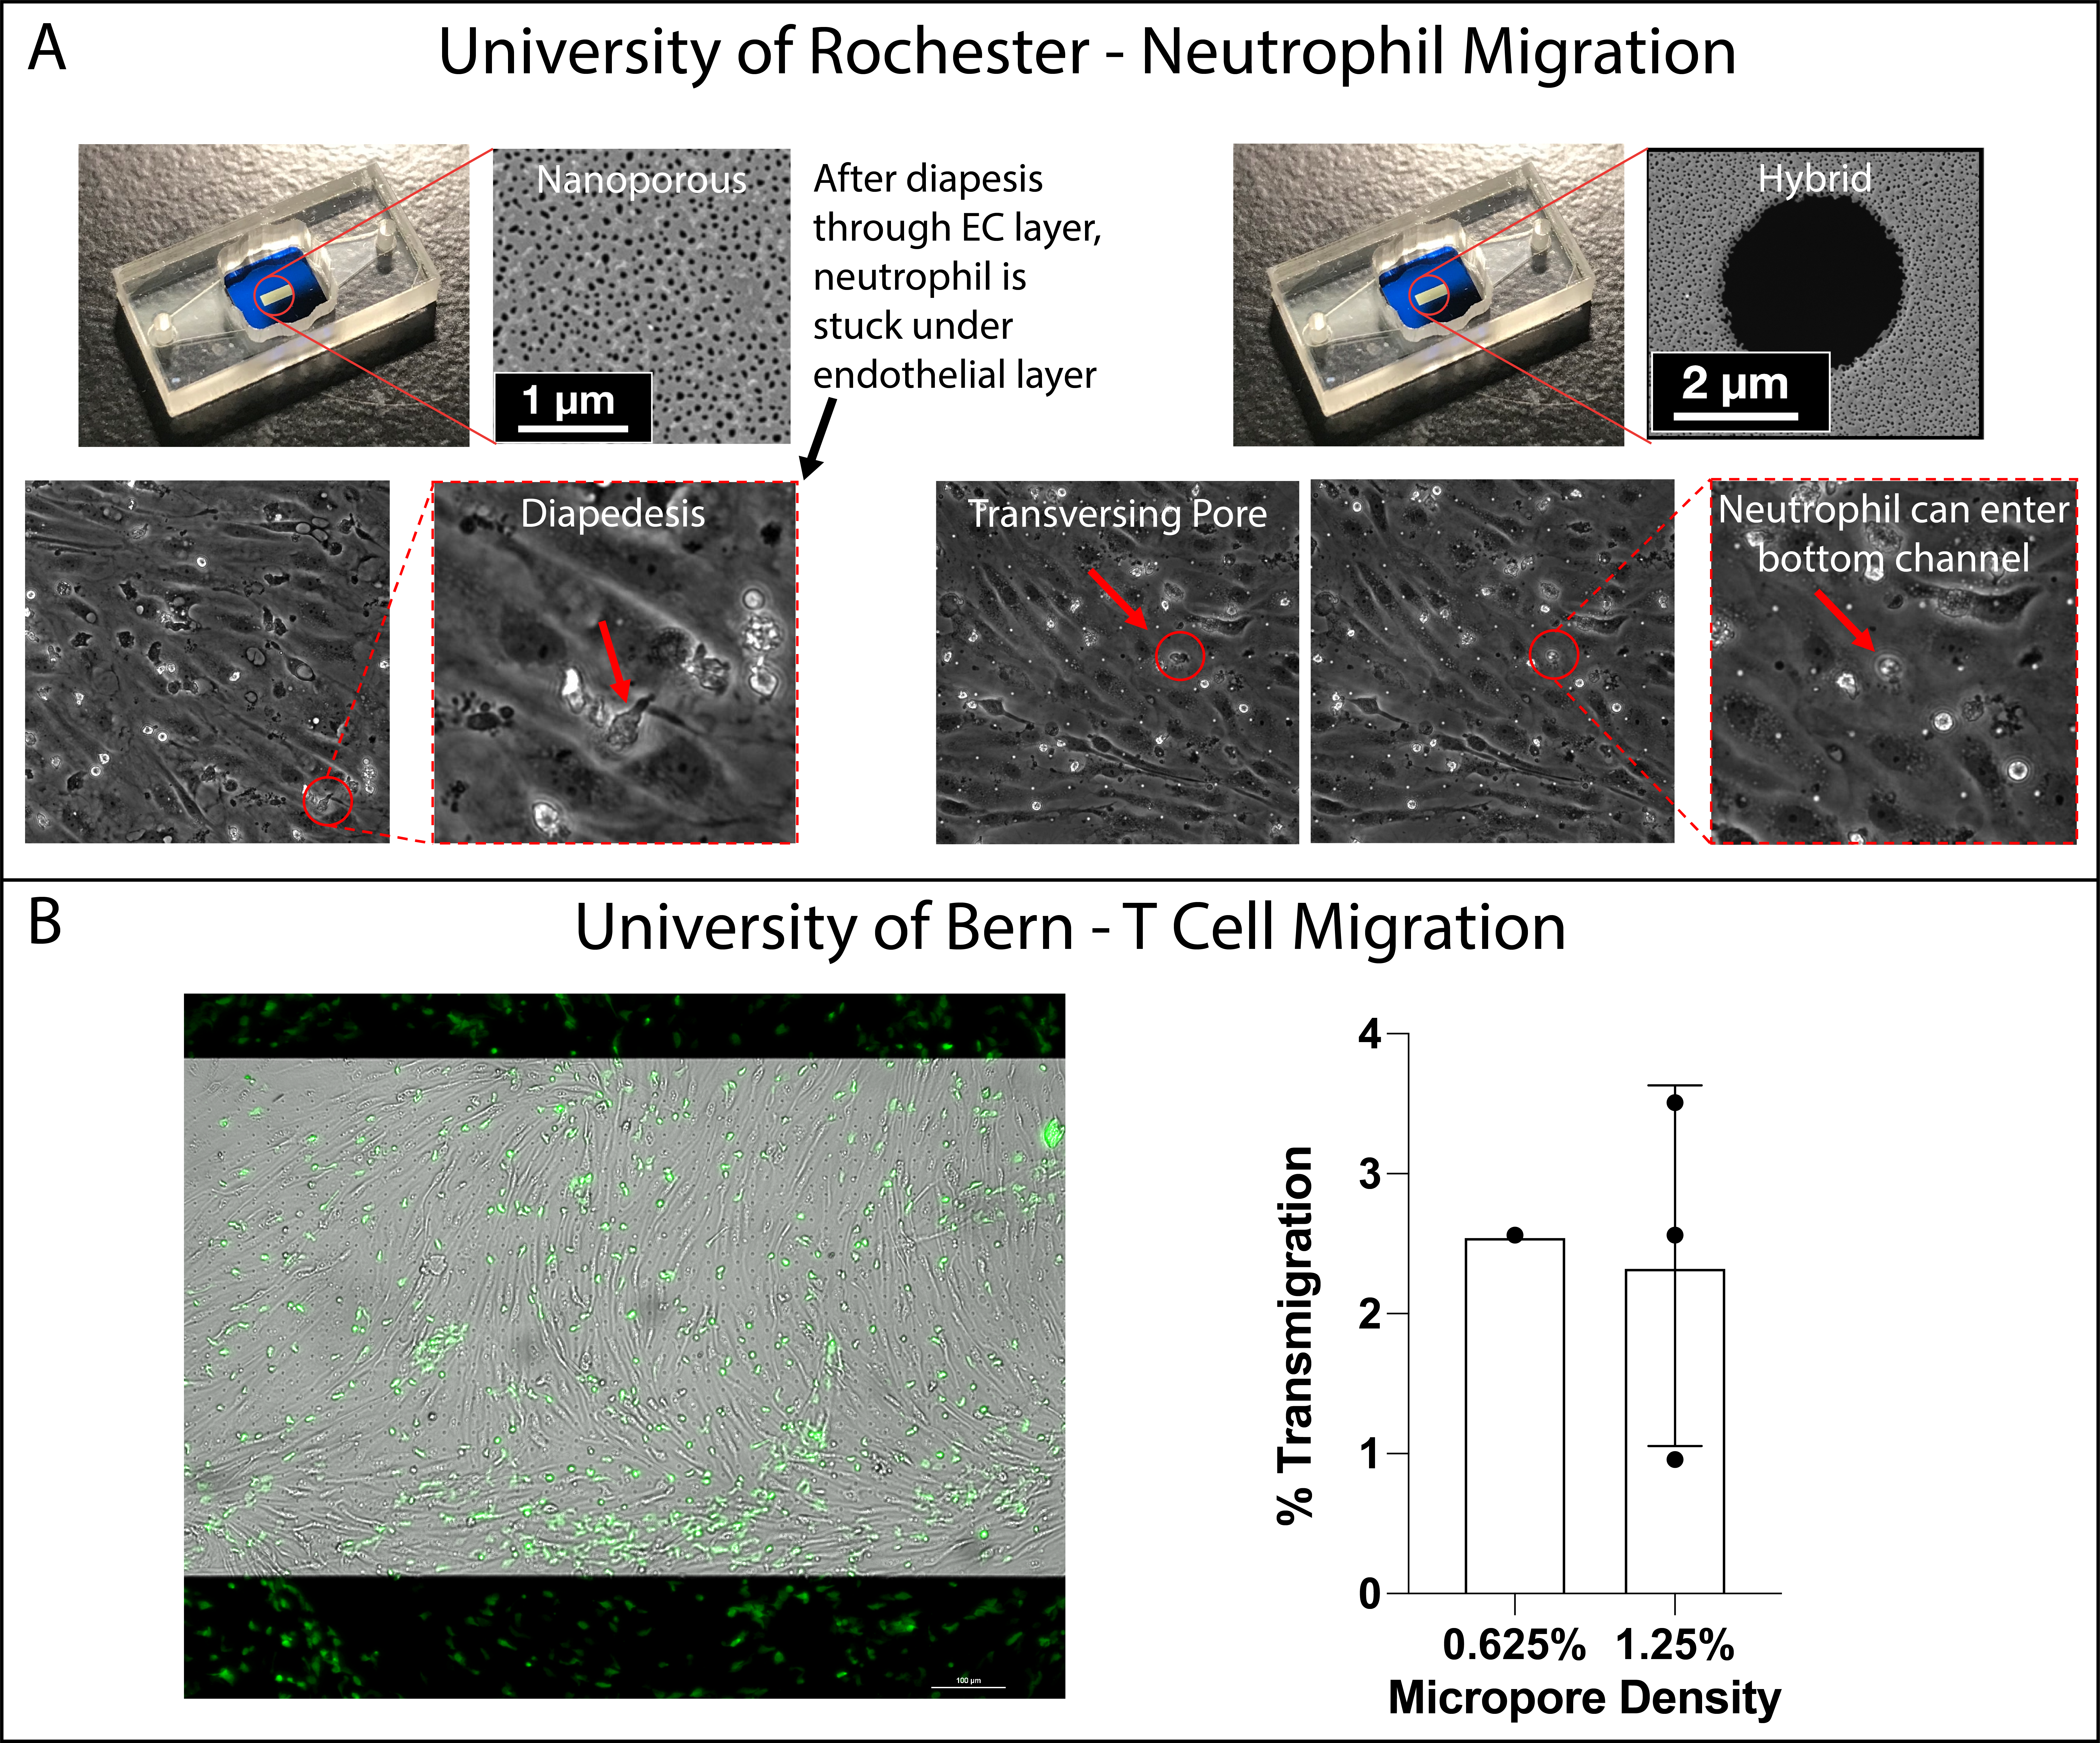
Fig. 7. Modularity of m-µSiM is demonstrated in immune cell transmigration studies. (A) Neutrophil migration across EECM-BMEC-like cells. While migration using both NPN and hybrid membranes can be analyzed by video tracking, only neutrophils migrating across hybrid membranes can enter the bottom channel and be collected for further analysis. (B) Statement about Bern T cell migration.
At UR, we need to repeat with Dan’s optimized methods. The EECM-BMECs recede in videos for NPN.
At UniBe, we see about 3% migration of T cells into channel after 2 hrs on non-stimulated EECM-BMECs. Transwells usually have about 10% migration but higher micropore densities. We have several example images of remaining adhered T cells. We would need to repeat 0.625% micropore density if we want to include both since two chips broke in preliminary experiment. We could also cut 0.625% and just show we see nothing across NPSN.
In order to figure out the relationship between grain size and pore size, I tried to use XRD measurement to determine the grain size by Scherrer equation. t = kλ/(B cosθ) where t is the average grain size, k is the shape factor that is in the range 0.87-1.0 (it is usually assumed to be…
Introduction In addition to in situ measurements of small molecule permeability (Parts 1, 2 and 3), we wish to enable an assessment of permeability by sampling from the abluminal chamber of the µSiM in a manner similar to what is done with Transwells®-style devices. To begin this, we need to review the methods used with…
I’ve updated by 3D separations figure by using actual DLS sizes rather than the dimensions roughly obtained from crystal structures. I have run into a snag with reporting the data however – use sizes by intensity or sizes by number. The difference is due to the fact that the raw DLS data is from intensity,…
The last time I did live imaging on the confocal microscope was in December of 2019. Then I was imaging the capture of 1.24 µm diameter beads in 1 µm slit pore membranes to visualize the difference between steric and affinity based capture. This time around, all of the materials are different, but the process…
In my last post I reported findings that the bottom well of a CytoVu assembly is capable of adsorbing protein at about 0.03 ug/mL, or 0.75ng of protein. This is a fairly small value, but for the purposes of a sensitive separation such as the FLAG tests that I’ve been working on, it can be…
This paper touches on two thing of current interest to me: Electrical Impedance Spectroscopy (EIS) and troponin detection. Tropinin detection has been identified as a useful biomarker for a chip based blood analyzer. Tropinin is a plasma biomarker that correlates strongly with a recent heart attack. EIS is a technique we’ve heard about in the…