hCMEC/D3 Barrier Formation
Goal
In preparation for experimentation with hCMEC/D3, an immortalized BBB cells line, I characterized barrier formation by taking TEER. I want to find peak barrier formation to determine what day to run assays.
Methods
hCMEC/D3 were maintained and passaged in EGM-2 (EBM-2 + multiple gfs + gentamicin + 2.5% FBS) with growth factor concentrations matching what was recommended by Diana Hudecz (collaborator). These concentrations are lower than recommended by the media kit. Cells were seeded in collagen 1/fibronectin-coated Transwells in assay medium (EBM-2 + hFGF + hydrocortisone + gentamicin + 2.5% FBS). 40,000 cells/cm^2 were cultured on 0.33 cm^2 Transwells (1.0 µm pore) and grown for 10 days with media switched and TEER taken each day using an EVOM2 and EndOhm cup, with the exception of Day 5. TEER was normalized to measurements taken on blank wells on each respective day.
Results
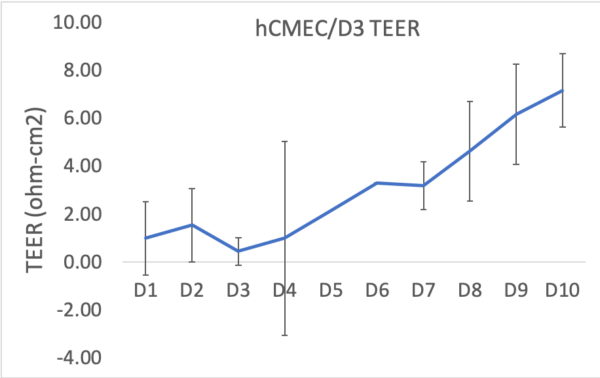
TEER continued to increase over the course of the experiment. No TEER was taken on Day 5, but Day 6 was taken but all readings were the same (standard deviation = 0). The experiment ended as we needed to exchange the cup and return it to the provided.
Discussion
It is unclear if it would continue to increase or plateau past day 10. Papers vary from 4-13 days of growth before experimentation. TEER remains low, which is expected for this cell line (although maybe not this low). It can increase with addition of lithium chloride or fluid flow. I may repeat experiment but start taking TEER at day 6 and continue until the peaks or plateaus. I want to use these cells for permeability assay optimization and transmigration optimization. Other thoughts are to seed higher (even in devices) to see if I can get it to peak earlier and don’t have to wait as long.
Nice Post! How did they look in terms of confluency over the 10 day period? Do you have any estimate of what ratio of 40000 cells/cm^2 remained attached on the sample after Day 1?
The Transwells aren’t transparent but I did a side-by-side in a 96 well plate. They were confluent after day 4 and looked healthy for the remainder of the experiment.
Since the cell growth and even the initial cell adhesion after seeding can be much different on these porous membranes and tissue culture plates, I think it would be valuable to know when they reach confluency on these transwells. For me, sometimes the size of the samples also affect the speed of cell growth. Here is my suggestion, since these transwells are not transparent, you can fix and stain them in different days, and image them by flipping the membranes like what we usually do for imaging on wafers (if they are not transparent even for fluorescent staining). Additionally, it is also interesting for me to know how many of the cell can attach shortly after seeding. You also can measure that with the same method.
This seems interesting. I just have a few questions?
Does the error bar shows collected data from the repeats on one sample, or it shows the measurements on different samples? And how many data points are for each day?
Do you know why some values in the first days are lower than the blank wells? (especially in the third day that the average is below around 0.5 or 0.6). Are theses measurement errors, or do cells reduce TEER before getting confluent?
Thanks for the response. The error bars are for different samples. I had three blank wells and three wells with cells. I took one measurement in each well each day. The first few days, the wells with cells were well below confluent, so the TEER was essentially the same as background. Because there is variability even within background measurements, some of the cell readings in the early days were below the no cell average. The drop you see is likely just part of that error.
Thanks for the suggestions too!