Beta-2 Microglobulin protein, and its surrogate Cytochrome c
Introduction:
Kidney failure, also called ESRD, is the last stage of chronic kidney disease (CKD) where kidneys function below 10 to 15 percent of their normal levels. In the United States, there are over 660,000 ESRD patients from all ages, genders, and backgrounds. ESRD causes reduced urination in the body and subsequently, waste products and excess fluids are accumulated, electrolytes are unbalanced, enzymes and hormones are abnormally produced, and most importantly, blood is contaminated with uremic toxins.
Dialysis is the most common diffusion-driven membrane separation process were specific molecules are preferentially transported through a dialyzer. This state of the art treatment imperfectly manages the condition; the last stage of CKD. During hemodialysis, blood is cleared from uremic toxins, which is 1.4 times the total amount of blood in the patient, through the dialyzer’s tortuous flow paths. Post-dialysis patients continue to suffer from waste accumulation, low blood pressure, anemia, muscle cramping, difficulty sleeping, pericarditis, and depression.
Objective:
In this study, the quantitative measurement of the exit concentrations of middleweight proteins such as Beta-2-Microglobulin (β2-M) and its surrogate Cytochrome c, were studied to determine the effectiveness of the highly detective NPN membranes, their porosity in clearing uremic toxins, and as a validation of NRG’s use of Cytochrome c in past studies.
Background:
Cytochrome c (12 kDa) was used as a surrogate for B2M (13 kDa) because the molecule’s strong visible absorbance at 405 nm facilitates detection in the presence of albumin.
Methods and Materials:
Micro-Dialysis devices were constructed using double slot 5.4 mm x 5.4 mm membrane chips that were locked between two 300 µm thick silicon squares to test dead-end protein filtration; where protein solutions were pipetted into the top basket. End-point study experiments were conducted separately for each protein. To elaborate, three devices were suspended in a protein-free buffer (PBS) and then, placed in a hydrated system to prevent evaporation. During every trial, this setup would be placed in a refrigerated environment for 12 hours as the proteins diffused through the membrane. In order to detect the fluid’s decrease in Cytochrome c contamination, a colorimetric assay was done. On the other hand, an ELISA assay was done to detect separation of the B2M protein molecules. Absorbances were measured using Tecan Infinite M200 Microplate Reader at 650 nm and 405 nm for B2M and Cytochrome c, respectively. In order to assure a diffusion-driven process and prevent pressure differences from forcing protein molecules to cross the NPN membranes, fluid levels were matched during the experimental setup.


COMSOL was used to model a finite element analysis (FEA) of the membrane dialysis study that simulates the separation process of lowering the middleweight proteins’ concentration in PBS. Diffusion coefficients (1.38E-9 m2/?) and membrane porosity were appropriately set to resemble the real experiment. The figure on the left displays the setup at the start of the experiment (0 Hrs) while the right figure shows the equilibrium after separation (24 Hrs).


Experimental Setup (Detailed):
- Build 6 microdialysis (SepCon) devices
- Obtain 6 sets of SepCons (upper and lower baskets)
- Drill hole in each Sepcon’s cover using 1/8″ tool
- Cut and place C-shaped gasket w/ open side facing tick mark of the cover
- Place Double Slot chip w/ membrane trench side up in each device
- Cut the square shaped gasket and place on top of membrane chip
- Close the device
- Cover lower side with parafilm
- Place in 3D printed device holder
- Prepare B2M and Cytochrome c Solutions
- 1000 pg/mL B2M in Diluent NS (Serial Dilution)
- 1 mg/mL in Diluent NS
- Pour 15 mL of Diluent NS and add stir bar to 50 mL beaker
- Pipette 60 uL of solution into each device
- Cover top of SepCons w/ parafilm
- Place in 1000 mL beaker and surrounded w/ wet wipes and cover w/ parafilm
- Center on stirrer plate (150 rpms) and put in fridge for 12 hours
- Collect a 50 uL (or all) sample after 24 hours and store in microcentrifuge tubes

Results:
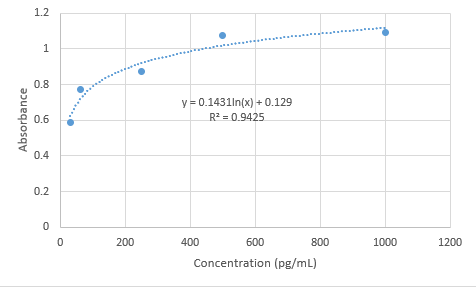
Beta-2-Microglobulin Standard Curve:
Cytochrome c Standard Curve:

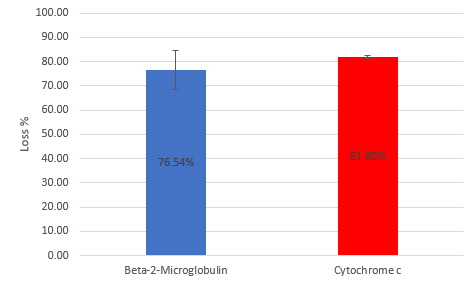
Final Loss Percentages:
Data Analysis:
Beta-2-Microglobulin:
Avg Loss = 76.5% stdev = 16.1 % SEM = 11.3 %
Cytochrome C:
Avg Loss = 81.8% stdev = 1.08% SEM = 0.77%
From the shown graphs and calculated loss average, standard deviation, and Standard Error of the Mean, it can be shown that over a period of 12 hours, the loss percentages of toxin protein B2M and its surrogate, Cytochrome c are very close to each other. While B2M had a concentration loss percentage of 76.5%, Cytochrome c lost 81.8%. Both standard curves were valid as they had R^2 values of over 0.943. The data for both proteins fall within the same range of loss %. This data was consistent as every protein experiment was done using 3 devices. In addition, it validates the use of Cytochrome c as a surrogate for B2M due to its availability, cheap cost, and efficient detection assays.
Statistical Analysis: Paired t-Test
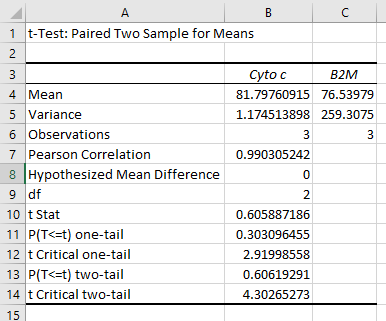
The t-value is 0.60589. The p-value is .60619. The result is not significant at p < .05.
Diffusion Coefficient:

D = Diffusion coefficient (m2/s)
kB = Boltzmann constant
T = The temperature (K)
n = The dynamic viscosity (Pa*s)
r = The radius of the spherical practicle (m)
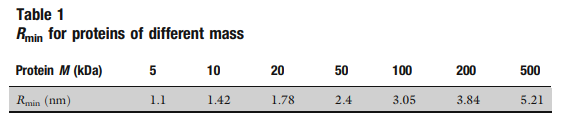
Paper: Size and Shape of Protein Molecules at the Nanometer Level Determined by Sedimentation, Gel Filtration, and Electron Microscopy
Author: Harold P. Erickson
Source: Biological Procedures Online, Volume 11, Number 1
Data:
Conclusion:
Diffusion is a time dependent process and consequently, time is a factor causing a variation between the clearances of the two protein solutions. However, these encouraging results prove that the NRG’s ultrathin NPN membranes are capable of separating proteins with concentrations ranging from mg/mL to pg/mL; nine orders of magnitude. This is also a validation of NRG’s use of the cheap and reliable Cytochrome c; surrogate for B2M.