Reducing intramolecular and interpore translocation kinetics variation by reducing initial entropy
My PhD exam was postponed (tentatively to early September but it’s up in the air still) due to an impending bureaucratic nightmare, so for the last few weeks I have been running more filter experiments, and I have discovered some interesting trends. While it is generally the case in nanopore experiments that the average dwell time for a given molecular length has huge variation, both between nominally identical molecules translocating the same pore and between pores using the same molecular ensemble, I have been finding that the dwell times in my filter experiments over the last couple of weeks have been remarkably consistent, with very tight dwell time distributions and good agreement between experiments.
To start off I’ll give you a quick overview and a few references for what we expect for the case without a filter, and what is understood about the origin of large variance in dwell time distributions. It all seems to come down to entropy. A polymer near the entrance of a nanopore will adopt a huge number of initial conformations, each of which will have a different drag coefficient. In simplified terms, a molecule which is initially elongated along the pore axis will have large drag because all of the monomers are being pulled together, whereas a polymer which is bunched up around the pore will have low effective drag since only the few polymers that are colinear with the pore feel the pulling force and contribute to drag. Some discussion and modelling of this phenomenon can be found here. They focus on intramolecular velocity fluctuations, but it’s not hard to see how this contributes to dwell time distributions. For short polymers, variations arise because of the number of orientations that a rod-like molecule can adopt as it enters the pore. In both cases, it all comes down to the initial entropy. I know of some modelling work being done that looks at reducing initial entropy, and they do indeed see tighter dwell time distributions, but so far I am not aware of any experimental work that demonstrates the effect. There is some work showing that dwell time distributions become more consistent when pores are size-matched to the DNA strand passing through it, but that is a different mechanism. For the regular case of DNA passing through a simple solid-state nanopore, dwell time distributions can be very wide, spanning multiple logs. A couple of examples of that can be found here for long polymers and here for short ones, though the spread here is attributed to interactions with the pore rather than entropy.
To date, I have not been able to find a reference that relates the dwell time variance to DNA length.
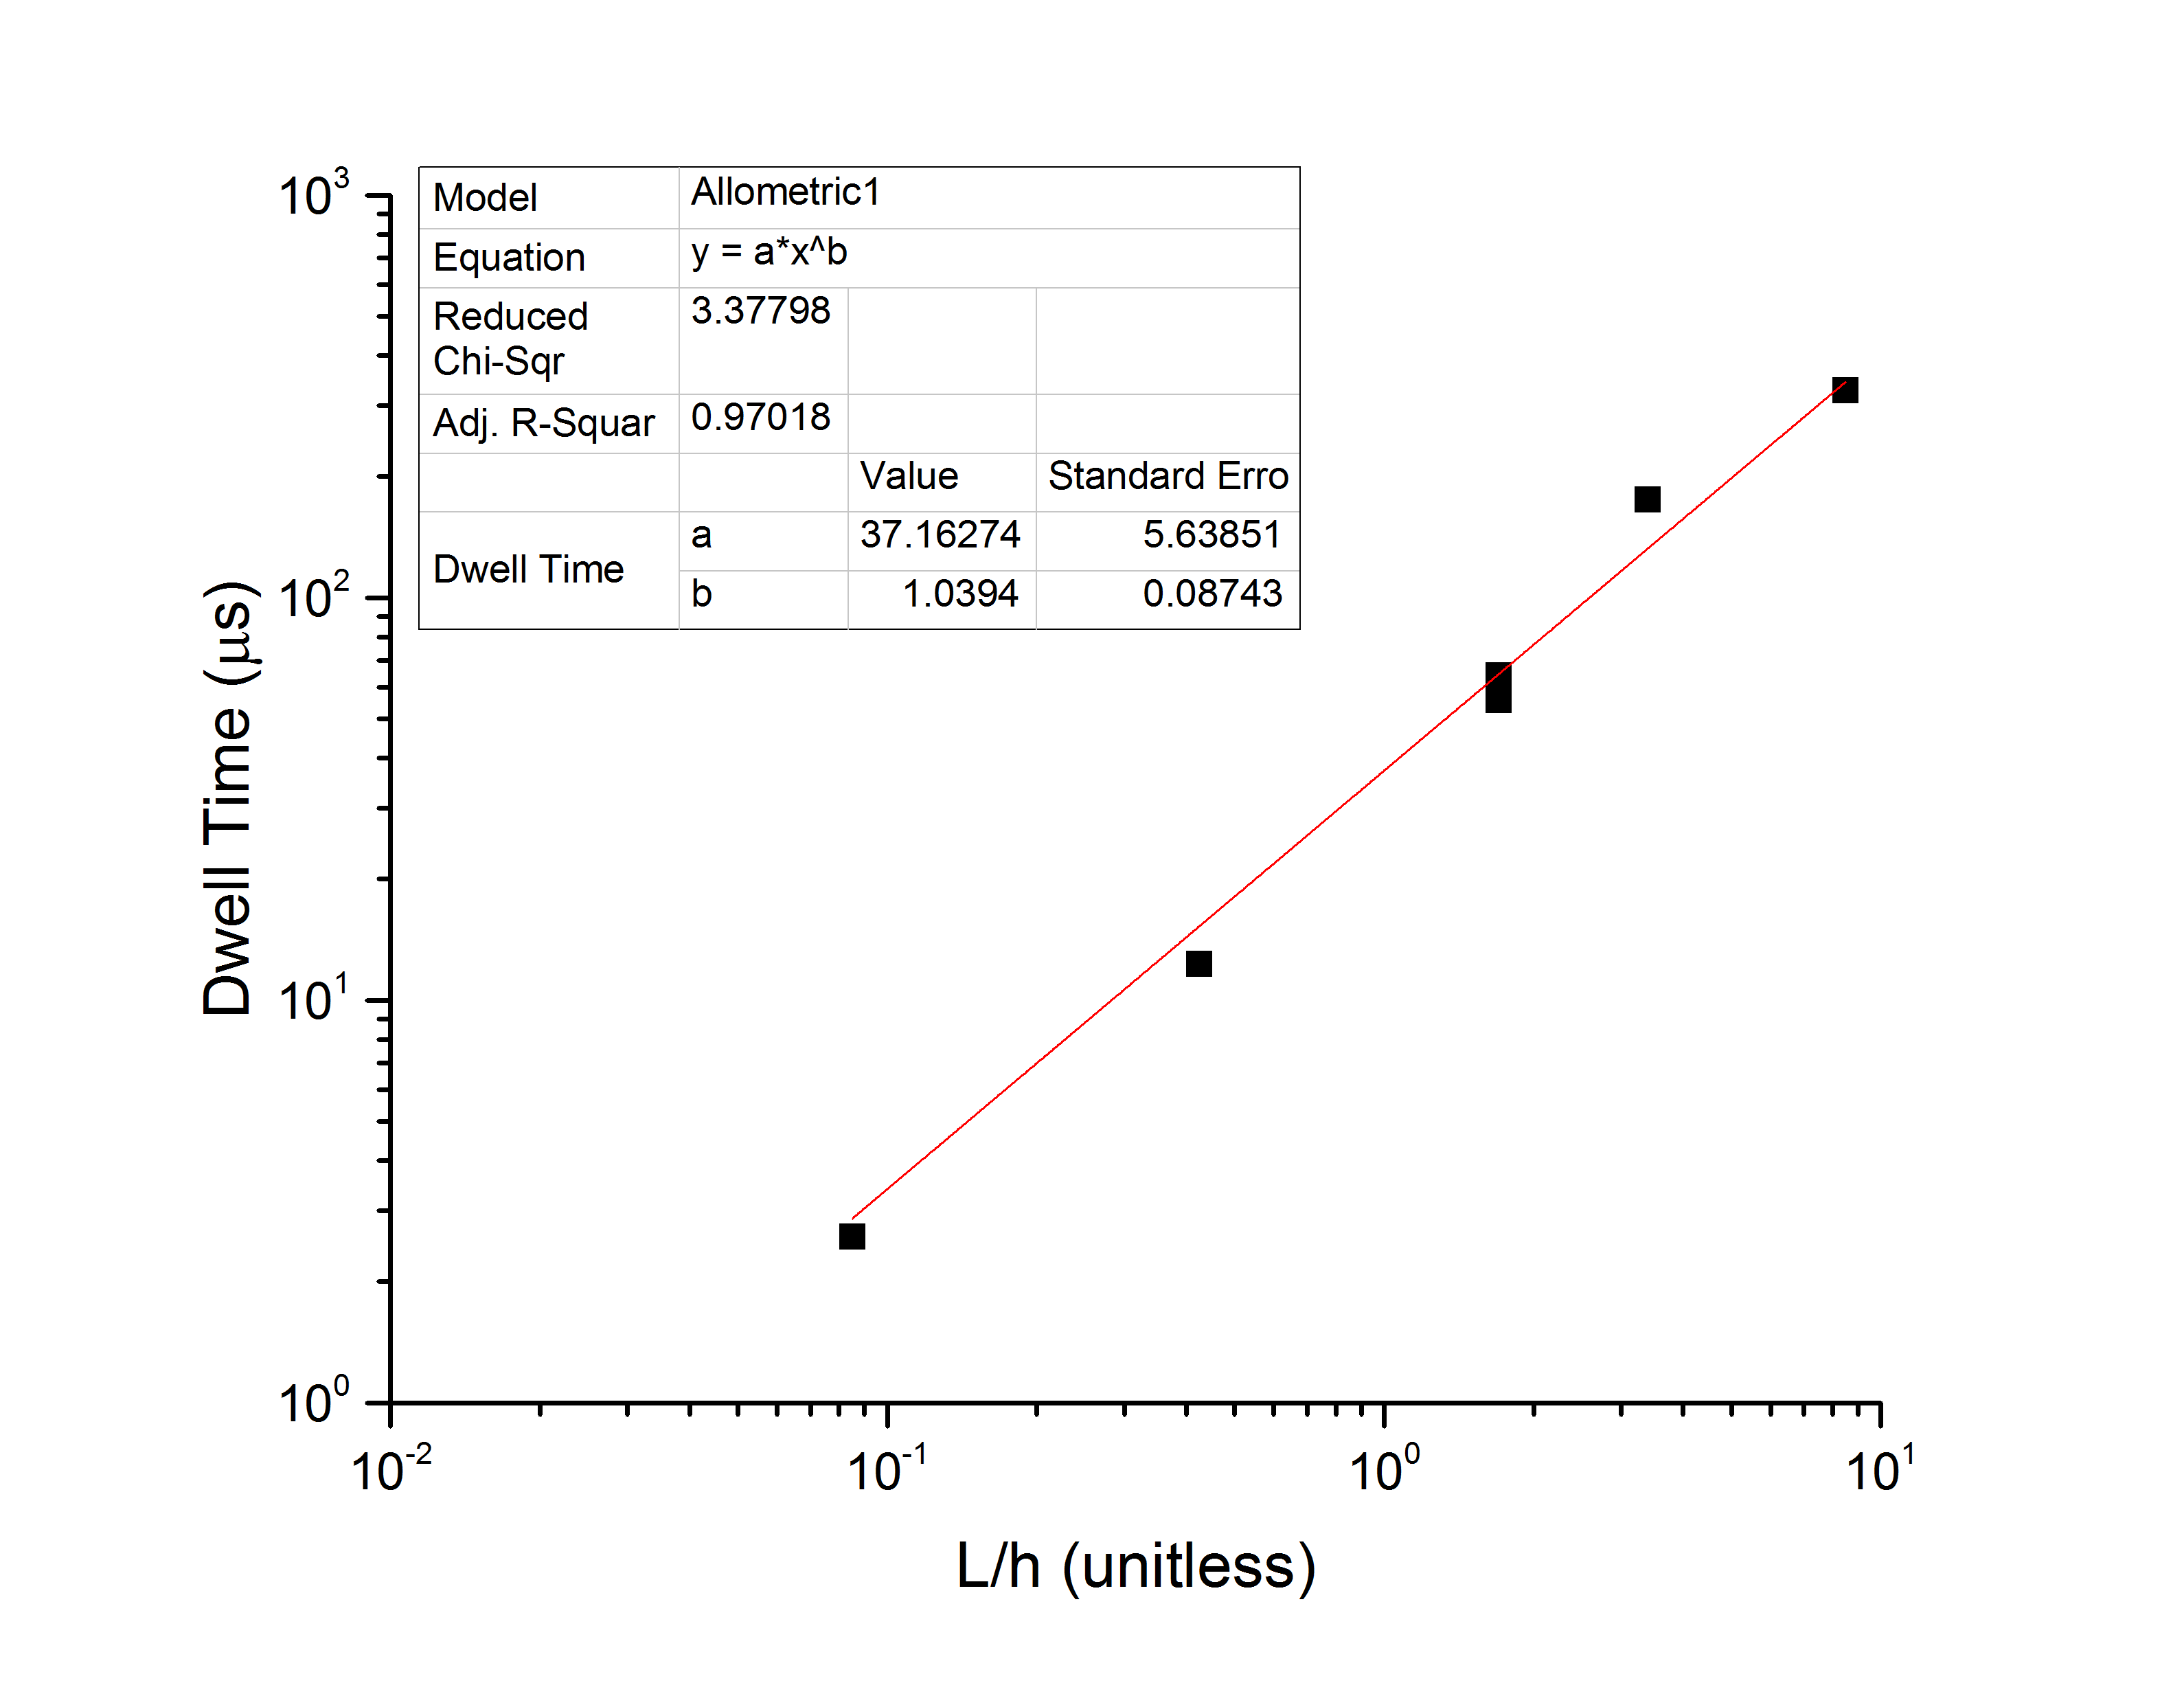
The average dwell time follows a power law in DNA length which you can see here, though in my own experiments the average dwell time varies so much between pores I am honestly amazed that they were able to get that data set at all. Simulations also show power-law scaling of the dwell time, with an exponent that varies but is greater than 1.
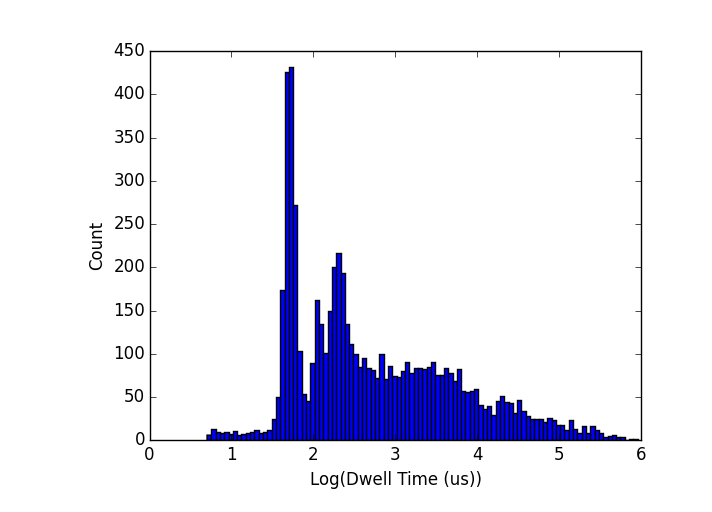
I have two excellent experiments last week in which I was able to collect data for a number of DNA points, all with very tight dwell time distributions. In order to look at scaling, I limit my analysis below to single-level events (ie, events where the DNA goes through without folding), though it actually doesn’t make a whole lot of difference if I include all of them. I have found that in all cases studied so far (50-bp, 250-bp, 1000-bp, 2000-bp, 5000-bp) the dwell times appear to be log-normally distributed. A couple of examples are below (top: 250-bp dsDNA in a pore which grew from 6 to 8-nm over the course of the experiments; bottom: 1000-bp dsDNA in a pore that grew from 6 to 14-nm over the course of the experiments) :
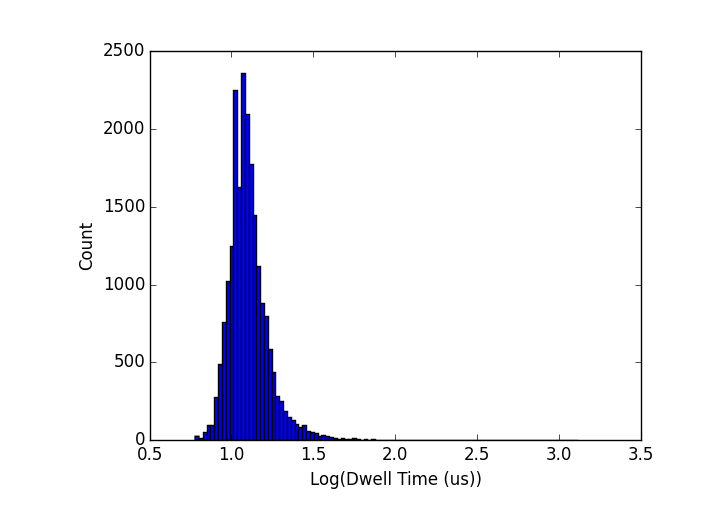
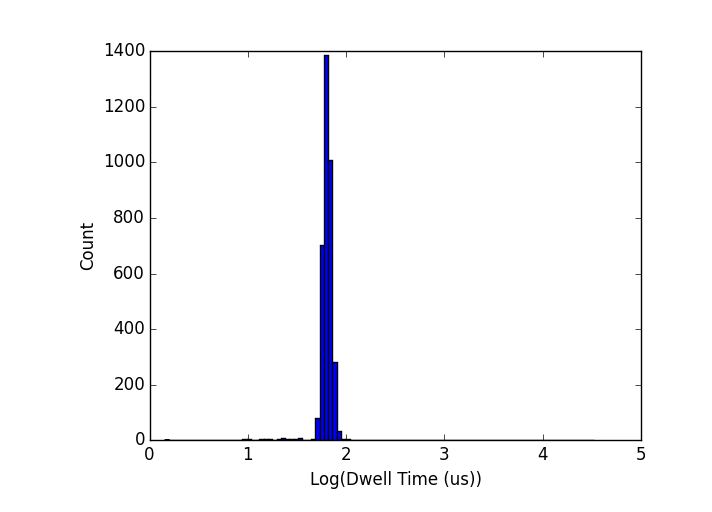
It’s worth emphasizing here that the tight dwell time distributions persist despite the fact that these pores are all unstable, growing over the course of my experiments. I will come back to this point later.
Fitting the log-transformed dwell times to normal distributions:

The parameters are related to the mean and standard deviation of the dwell time by


What I find, for the 6 data points over two pores that I have collected so far, is that the mean dwell time follows a power law in the DNA length, the standard deviation appears to be roughly exponential in the length, and the coefficient of variation (to third order equal to the standard deviation of the log-dwell times s) therefore has a global minimum value. In the following plots I have defined
 to be the ratio of DNA length to NPN gap height h=200nm.
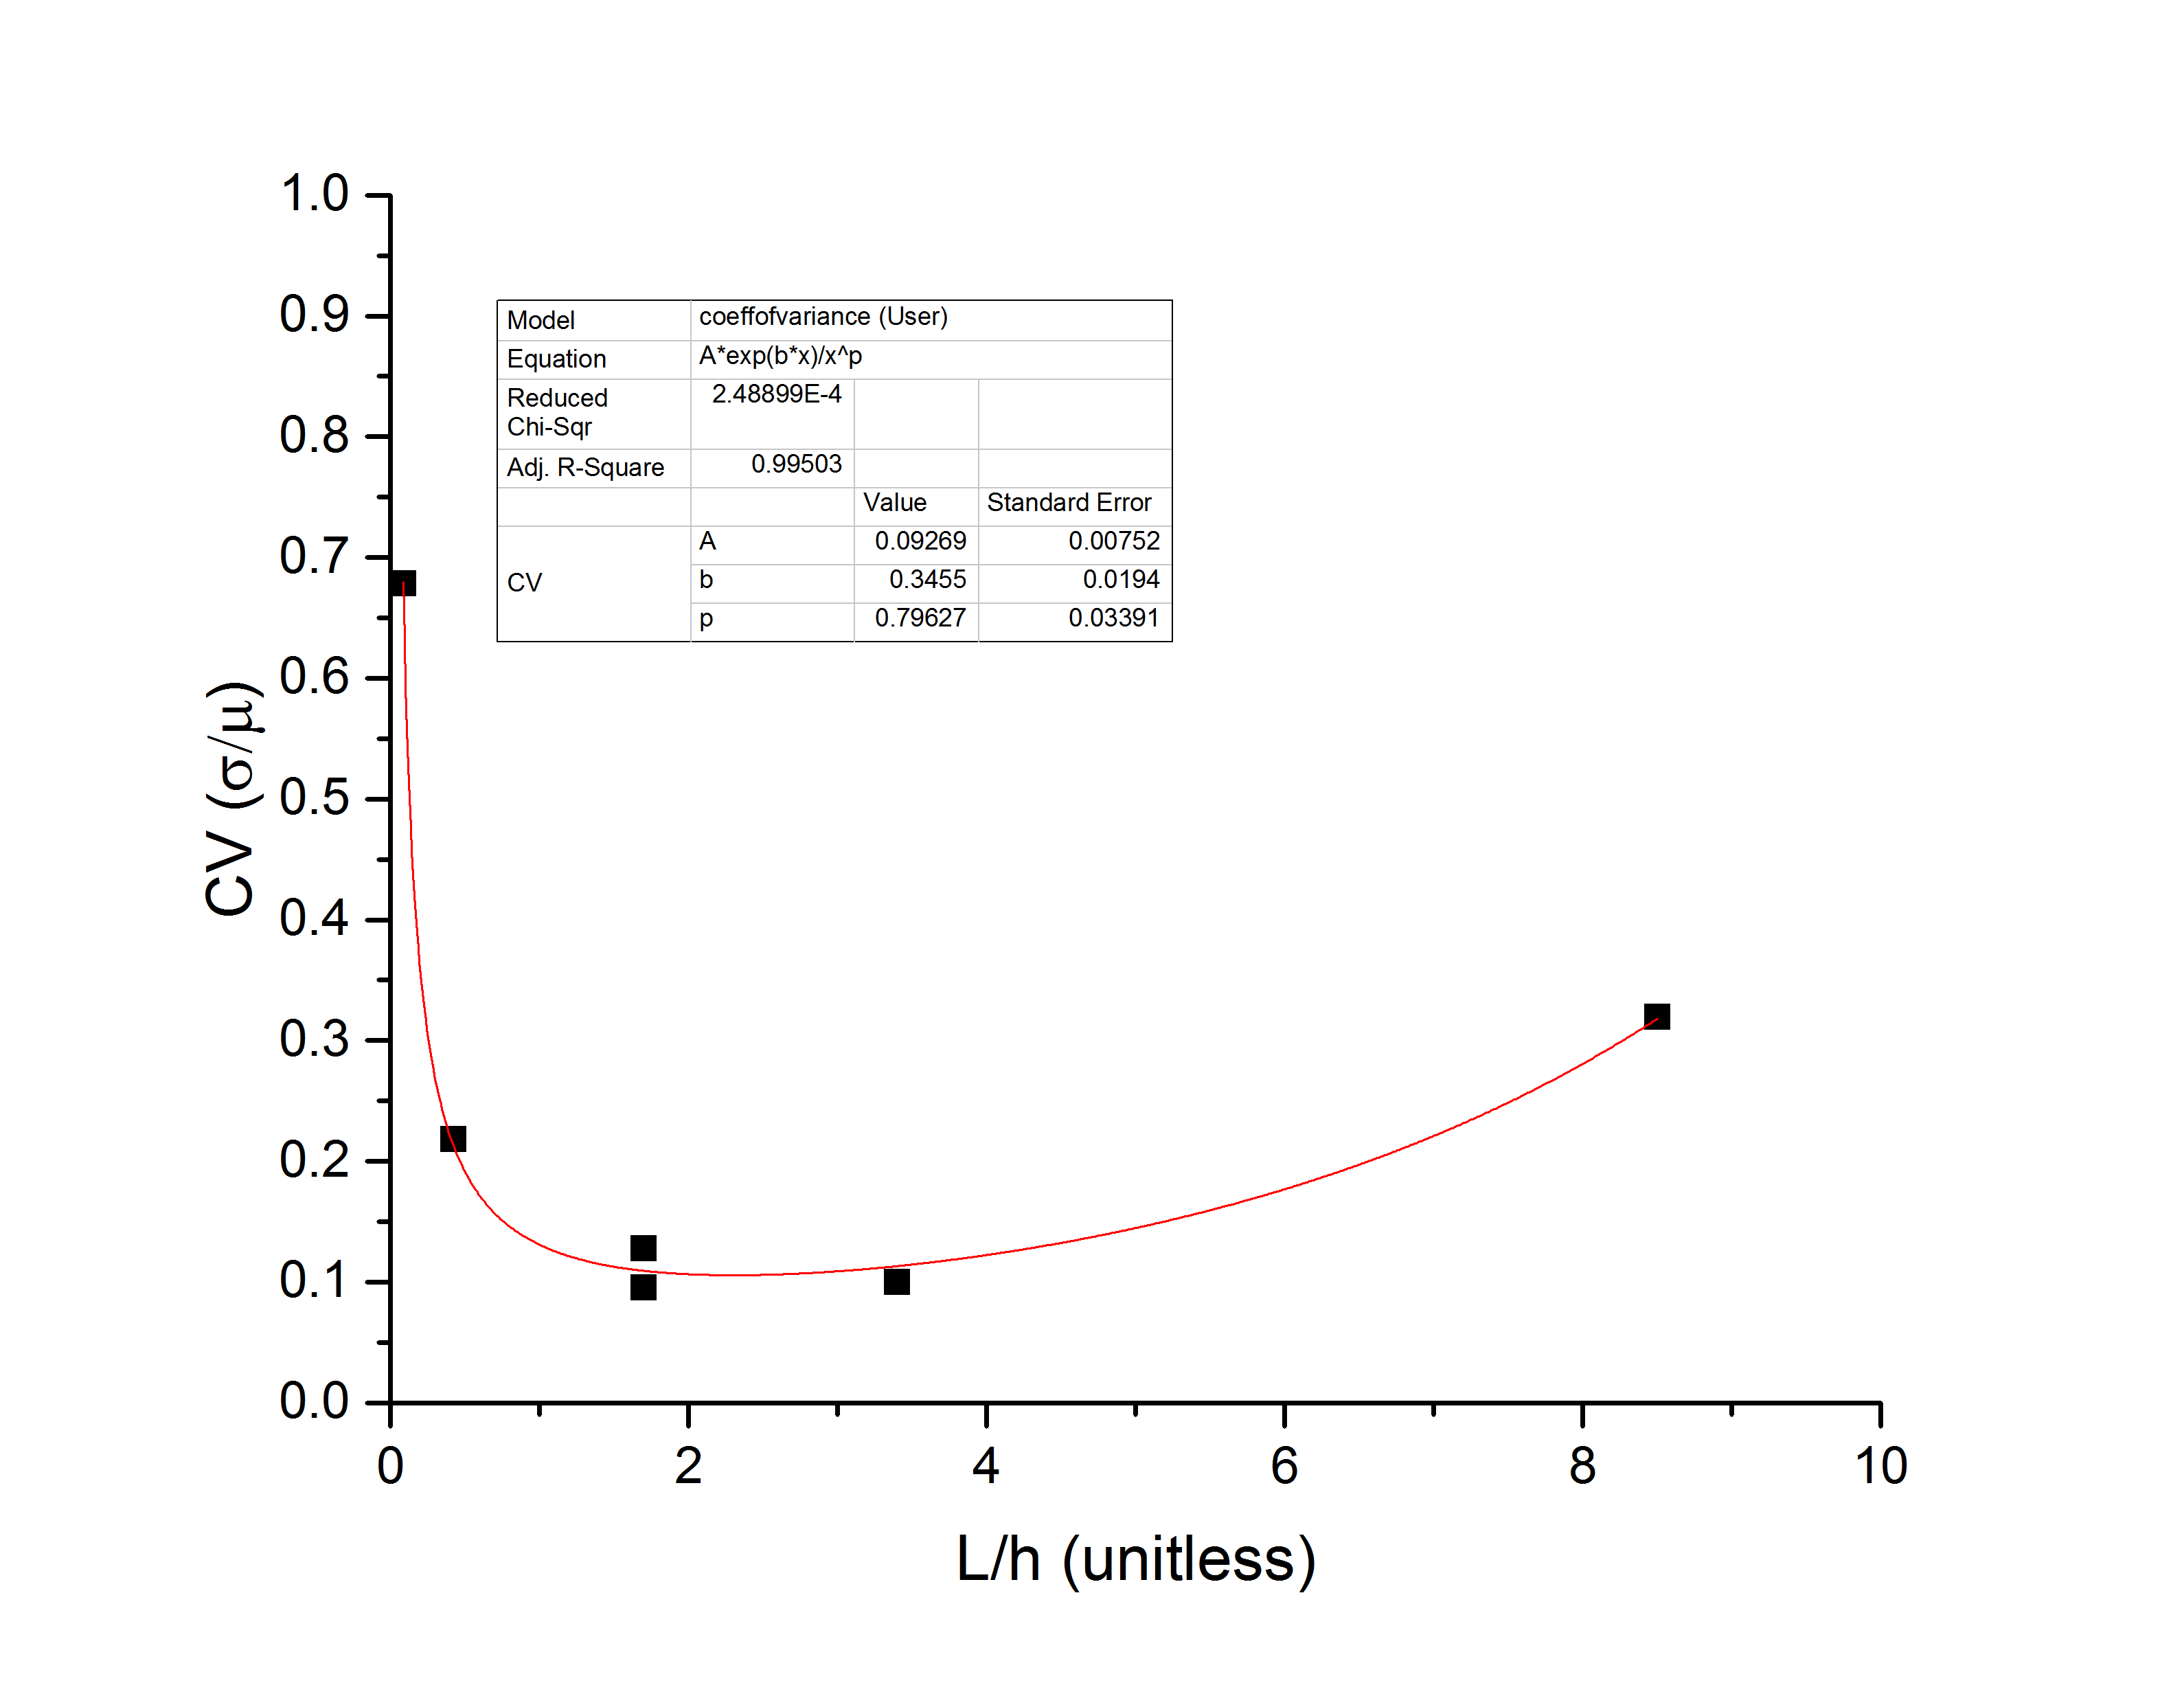

Take the actual numbers you see with a grain of salt – there are not enough data points to have a robust fit yet, and I can make the exponent vary between 0.8 and 1.5 simple by changing weights, so there is a lot more data needed before this becomes quantitative. However, I think there is enough here to start to talk about entropy, and why I think this minimum exists.
For medium length chains (long being defined as compared to the gap height h), the molecule must be to some extent linearized as it passes through the filter en route to the pore. This reduces the entropy of the molecule and makes the initial conformation much more consistent, reducing the spread of the dwell time and leading to a minimum in the coefficient of variation. For very long chains, the spread increases because it can sample multiple NPN pores and interact with the filter to a greater extent. We saw this with 10kb molecules apparently clogging by spanning multiple pores in my previous blog post, and so the coefficient of variation grows as molecules get very long. As molecules get very short, they can pass the filter and be in the gap entirely before they translocate the pore. As soon as they are fully inside the gap they can start to relax (subject to the local field gradients, which will tend to keep them away from equilibrium). As they relax, their entropy increases and the coefficient of variation starts to grow again. However, within the limitations that the NPN needs to stay in the capture radius, we should be able to tune the gap height in order to set the DNA length for which the coefficient of variation will be minimal. For the 200-nm height and the rather unstable fits we have so far, this length is 1500-bp, which is around x=2.4.
This is really exciting stuff. This is possibly the first direct experimental proof that reducing the initial entropy reduces the spread of the dwell times, something that has been predicted by multiple theory groups over the last few years. On the other hand, there is still a lot of work to do – I need more data to improve the quality of the fitting, and I need control experiments without the filter. To the latter point, I thing we probably as a lab have enough data just on regular pores to fill in that gap, but we should consider if we can use those as a control, or if we should use the membranes that have the oxide spacer (ie, is the oxide spacer an important control parameter? My feeling is that it is not, since the aspect ratio is so low, but we should discuss this).
Since the two pores that generated that graph, I decided to see if I could separate populations within the same experiment. To that end, I mixed 1k, 2k, and 3k-bp molecules at 15nM each and ran them at the same time.
Note that the peaks are centered where they should be if you compare to the dwell time graph above (1k is x=1.7) but the spreads are strange, especially the 3k peak. I will limit my experiments to one molecule at a time from now on since I don’t fully understand what is happening in this one.
A final piece of the puzzle that could be used to prove that the filters are affecting initial conformations is the distribution of capture locations for folded events. You can see a very nice paper on this here. In it, the authors derive and predict the distribution of capture locations by relating the relative dwell times of sub-levels for folded DNA events to a location along the molecule, and provide an analytical model which fits their data rather well. I plan to reproduce their analysis, and hopefully demonstrate that the distribution of folding is perturbed from their prediction as proof that our filters are linearizing molecules. Stay tuned for that in a later blog post.
A final point to mention is that these membranes are fairly unstable. Some nitride batches make for more stable pores than others, and we have not yet identified why this is. This particular batch grows by a few nm/hour during experiments. In spite of this, the tight dwell time distributions persist! The consistency between pores and during active pore growth suggests that not only are we increasing the consistency of the dwell times within a pore, we are also increasing consistency between pores, which is a very valuable thing. Inter-pore variability is one of the major hurdles I see standing between nanopores and clinical applications. It also suggests that the mechanism for inter-pore variability is related to to entropy as well – maybe in the high entropy filterless case the molecule can sample more of the vicinity of the poer and interact more with charges and features on the membrane. When the filter is there to reduce the entropy, not only does the molecule translocate more consistently, but it doesn’t sample the vicinity of the pore as much and is therefore less sensitive to the details of the particular pore it is passing through. I am not aware of any theoretical work claiming this, but it seems like some plausible speculation.
Assuming this continues and I can fill out those graphs sufficiently, I think this is our first paper. In other news, Dan is about a week away from a Au-NP based protein detection assay which would rely on the filters, which, if it works, would be the second one. We should discuss priorities soon, since either one of these projects will take probably the rest of the summer to wrap up. The NPN filters are very much feast or famine – when they work, they work wonders, and when they don’t work, they all stop working. There are still some kinks to be understood there, but for now I’ll just keep trying until the next feast.
What a incredibly rich playground we’ve created! I regret being too busy to digest it until today. Have you confirmed that the non-SiN capped oxide chips are all famine? That might provide one clue.
We are off to a conference for the week. We will reach out by e-mail to set up a call.
Awesome!
I have not actually used any of the chips without the SiN cap. I’m getting such rich data with the SiN capped ones I didn’t wan to change anything yet. I have about 35 of the SiN cap chips left to go through, which I think should be plenty to explore this phenomenon in detail.
I have since done another experiment with 250, 500, 1000, and 2000 bp dsDNA, and the first three fit the trends well (have not yet analyzed the last one). But the graphs are coming together fairly quickly, so I should have a more quantitative picture for you when we speak next.
Also – what is the ratio of feast/famine?
Hard to say, since my protocols have been changing as we go and the gold AuNPs showed no results for reasons unrelated to the filter. Of my last 14 pores (of which about 10 has filters), for which the protocols have been pretty stable, I have 6 that showed excellent DNA results.
Of the rest, I would say I lose about 1/4 of chips to issues with setting up the filter (wrinkles, PDMS painting errors, etc), and most of the rest are due to instability that is so extreme I can’t get results in time before the pore is too big, or high 1/f noise, which is a problem for regular membranes as well. There have been a small number that seemed good but showed no translocations for no obvious reason, but they are a minority.
All this to say, I would have a very hard time giving you an accurate number. But once I get a properly tented/painted filter chip, I’d guess 1/3 to 1/2 show good DNA results, and that number is trending upwards.