Getting (lots of) DNA though NPN filters
Warning: the following post contains spoilers for Vincent’s talk at Rochester on Monday.
Since the last update, I have tried to get the gold nanoparticles working properly, with no luck so far. The zeta potential we measured in KCl was 0mV, showing that even though we had visual confirmation that there were particle suspended in solution by the color, they were unstable. Even using very large pores (large enough to pass the conjugated molecules) produced only small clogs, which I take to be a sign that we need to try this gaain with smaller particles. There is a paper that Vincent linked showing nanopore experiments with DNA-conjugted 20-nm particles in 0.5M KCl, which I think is a good direction to take that side of the experiments.
On the other hand, I had some very successful experiments getting DNA through the filters. The first experiment I did was one I mentioned last time, but now I have been able to rewrite my analysis code to do full analysis on the file. It involved what was intially a 10.3-nm nanopore in 1M KCl pH 8, covered by an NPN filter, made in one of the SiN capped chips. The sample was 180nM 50-nt ssDNA with a non-reduced 5′-thiol conjugation (the same ssDNA that is conjugated to our particles). Over the course of the experiment (about 45 minutes) the pore grew to something like 31-nm, so it was quite unstable, but because I am mostly interested in event rate, I don’t care too much.
The full analysis includes detection of a whopping 114,918 DNA events, a personal record by at least an order of magnitude, and a factor of 2 larger than any I have seen in the literature to date. Of these, I have:
- 48,483 successfully analyzed
- 55,933 showed too few levels (can probably be corrected, eventually)
- 5,194 too fast
- 2,483 too close to neighbouring events to be separated
- 2,825 miscellaneous analysis failures
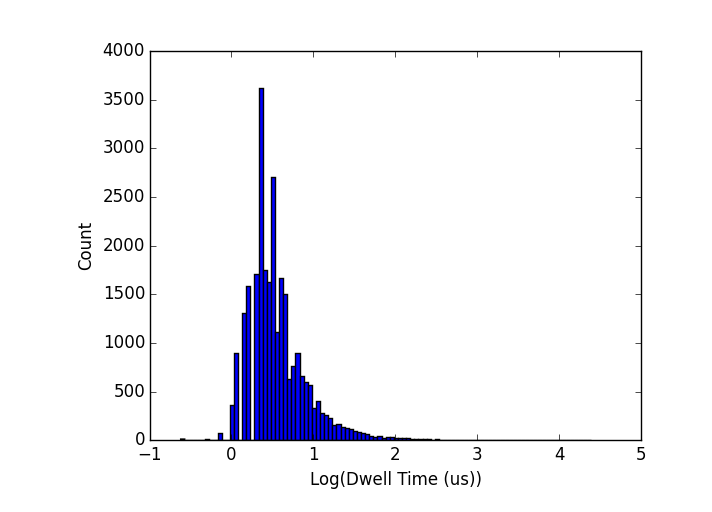
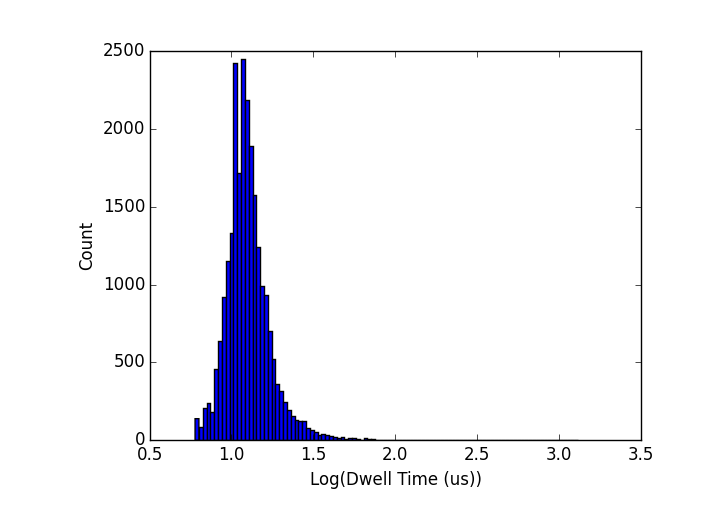
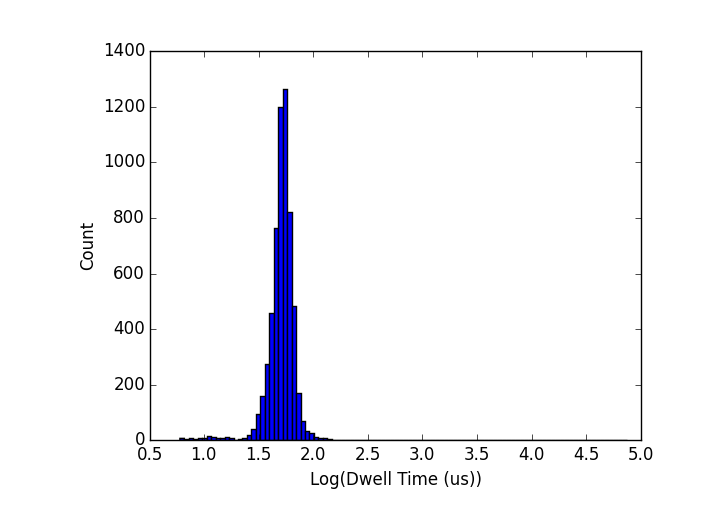
The events with too few levels can be corrected down the road – I know what the issue is, but I have to do some serious debugging to correct it so I have not yet had time. The average event rate was 0.28 Hz/nM, which is fairly high, a consequence of using the Chimera VC100 1MHz bandwidth to pick up even the shorter events. The dwell time for these molecules was surprisingly long (peaking around 100 microseconds), which is unusual for such short strands, but could be a consequence of non-specific DNA-pore interactions which are fairly common with ssDNA, or perhaps an interaction of the thiol group with the pore wall. A control experiment with non-thiolated ssDNA will be necessary to test this. I don’t think it is the filter slowing them down, for reasons which will become clear going forward.
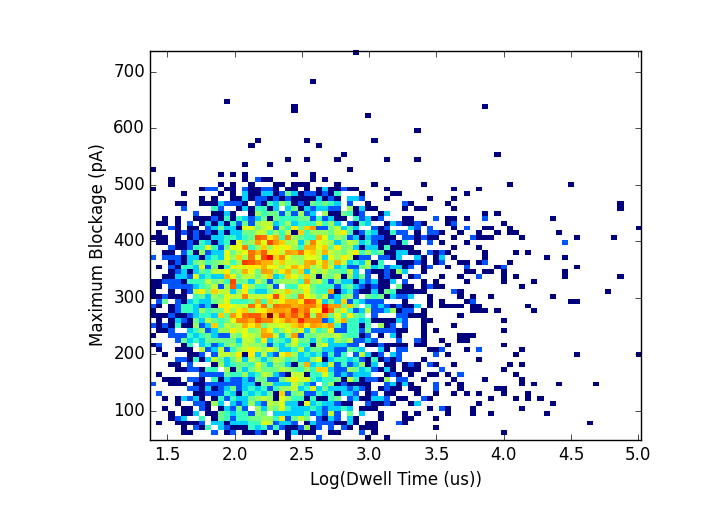
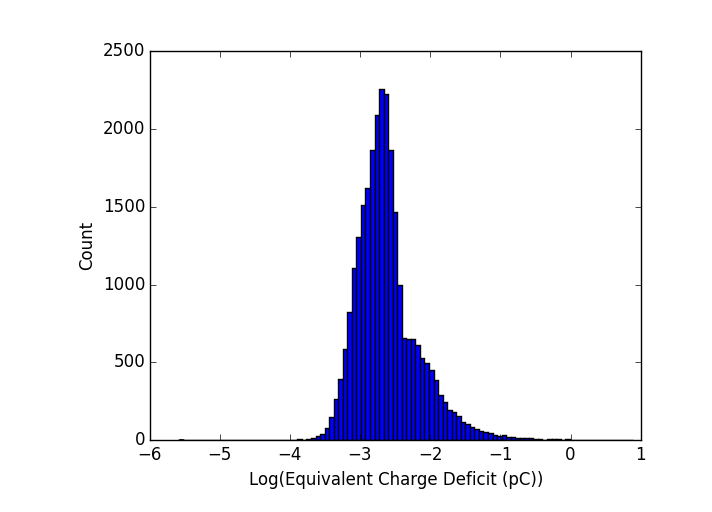
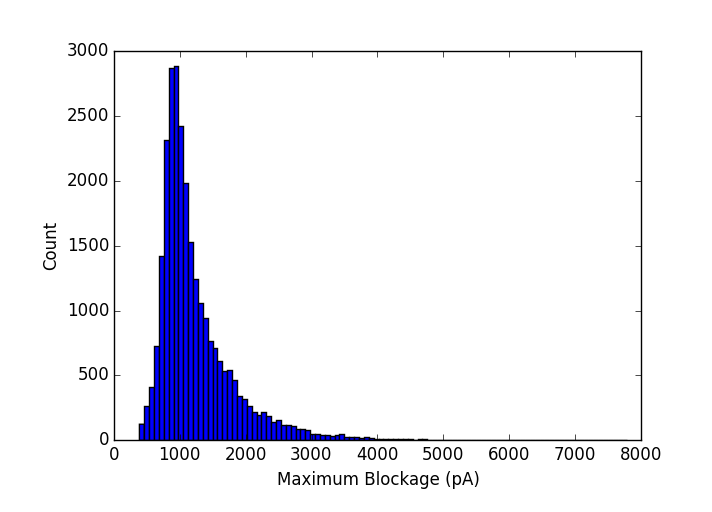
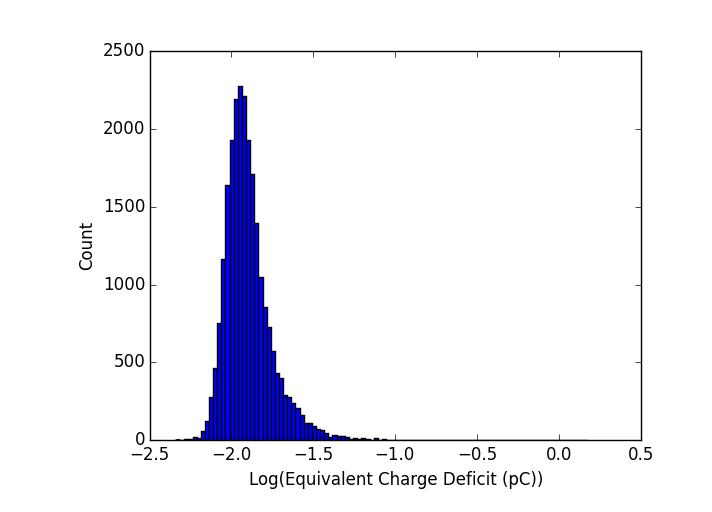
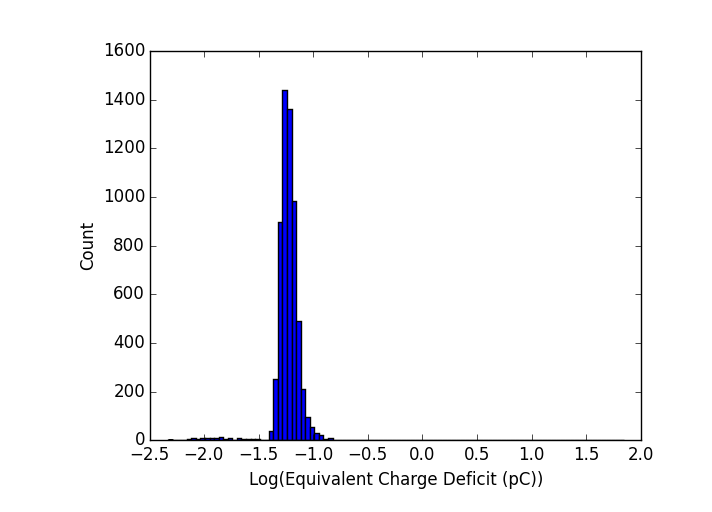
The distributions for the full data set are below. Note that the baseline changed throughout the experiment as the pore grew, but blockages are to first order independent of the baseline so we can still plot the entire experiment in one go.
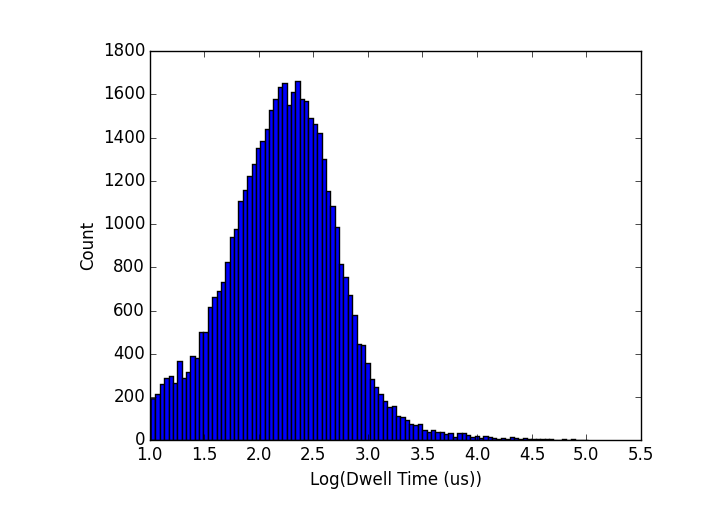
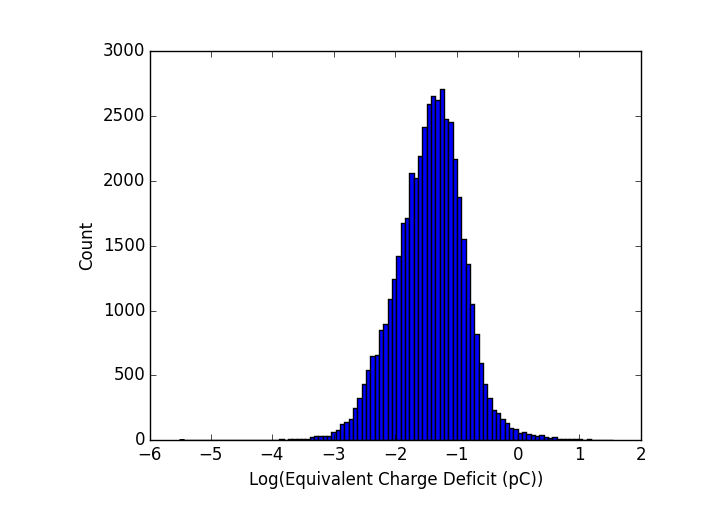
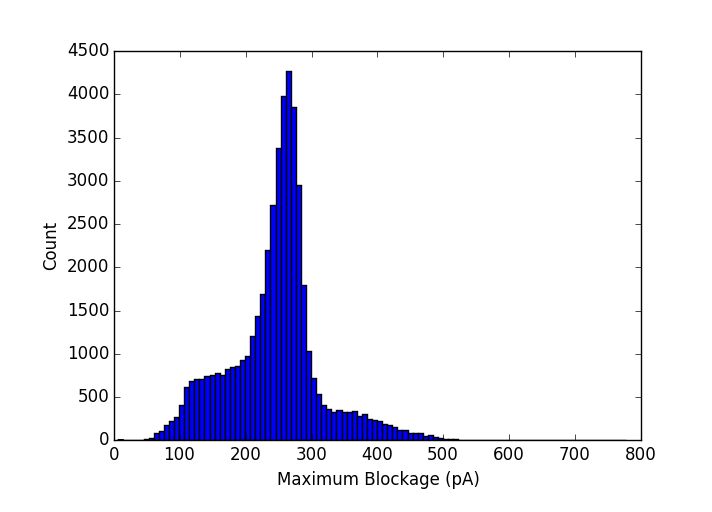
The blockage level is much deeper than would be expected in these conditions (~260pA versus expected 150pA). I suspect this is because the molecules are not linearizing as they go through the pore, but rather as passing as a blob, which is not surprising for ssDNA, which has a persistence length on the order of 1-nm.
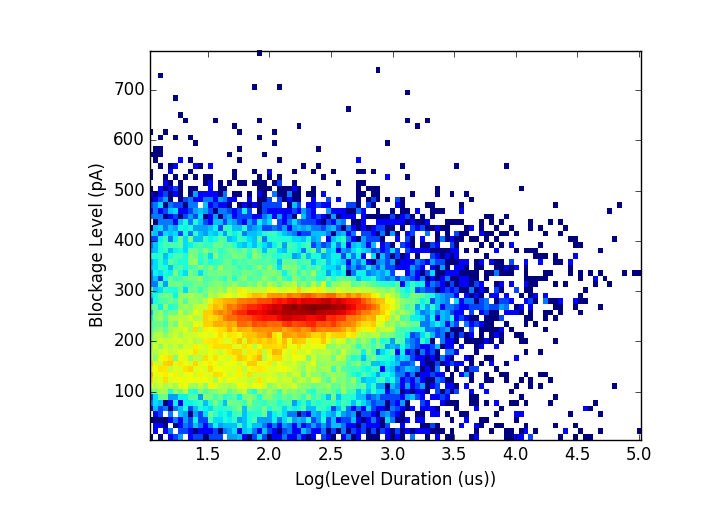
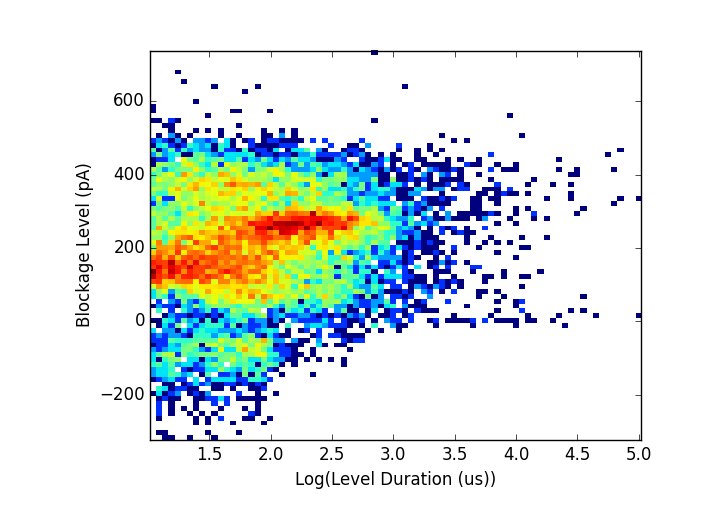
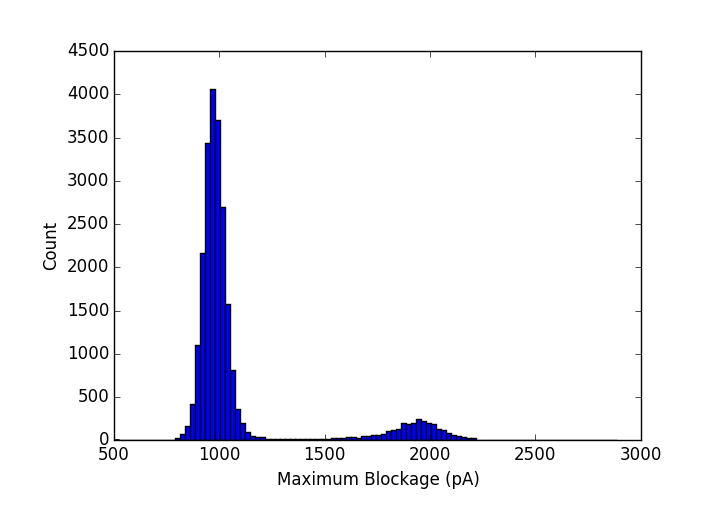
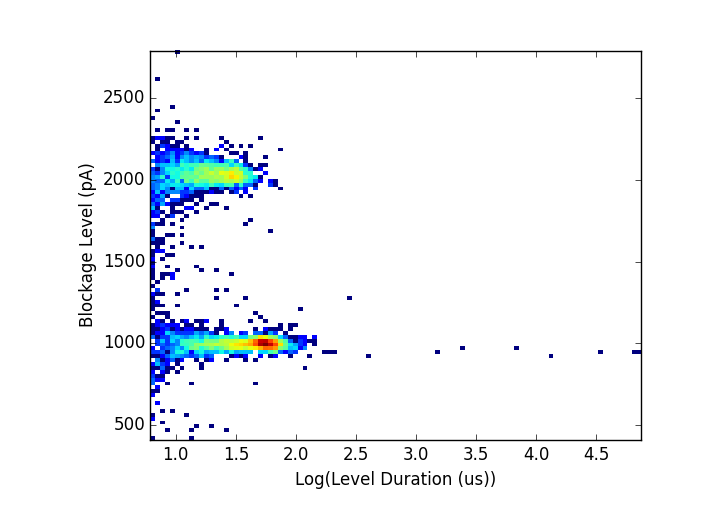
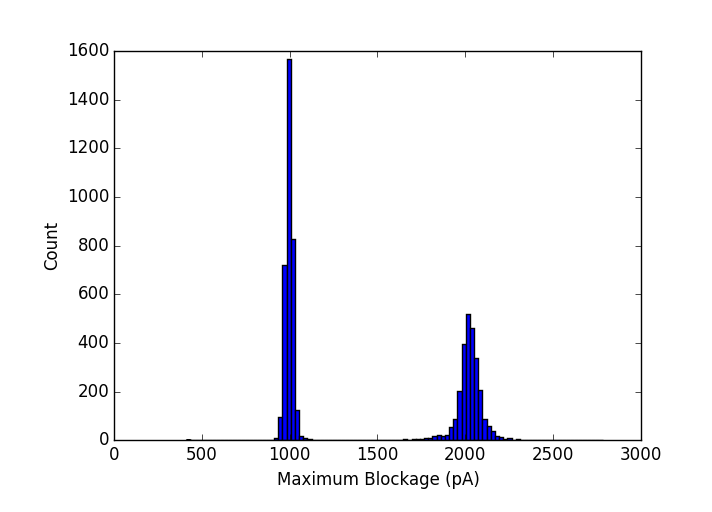
If we restrict analysis to multi-level events, of which there were about 7000, we see the emergence of two overlapping populations. It’s not clear what these would be, or if they are an analysis artifact (below).
My second experiment was a sequential ladder of dsDNA passed in 3.6M LiCl in a pore which grew from 7.1-nm at the start to about 8.7-nm at the end (using the nominal membrane thickness to estimate it). The first sample was 50-bp NoLimits dsDNA. The event summary is as follows:
- 214nM 50-bp dsDNA
- 69,912 events
- 27,052 successfully analyzed
- 39,387 too fast for good fit
- 3263 miscellaneous analysis failures
- Average event rate (including analysis failures): 0.12 Hz/nM
Again, an amazing number of events, an order of magnitude more than I would normally consider a very successful experiment. I am starting to come around on the idea that it might be straightforward to make claims about filters extending device lifetime. The distributions are below, showing a single blockage level around 1000pA, which indicates a corrected local membrane thickness of about 12.5nm, instead of the nominal 20-nm. This is not too surprising, as we have found that the thicker the membrane, the larger the local deviation from nominal membrane thickness when using CBD to make pores.

The small increase in apparent blockage level toward short dwell times is an analysis artifact – my analysis program has difficulty with very short events, something that I also need to debug when time is available. Note that the dwell times for 50-bp dsDNA are about an order of magnitude smaller than for the 50-nt ssDNA, something which should be investigated further. If short ssDNA lingers longer in the pore without actually causing clogs, it might be a very useful property to take advantage of when designing our filter assay.
The next experiment, done in the same pore, was with 250-bp
- 62nM 250-bp dsDNA
- 24,610 events
- 24,164 successfully analyzed
- 391 too fast for good fit
- 55 miscellaneous analysis failures
- Average event rate (including analysis failures): 0.18 Hz/nM
- Events in plots restricted to having < 6 sublevels and max blockage less than 3nA (removes 7 events, but cleans up some of the plots)
Dwell times are a bit longer here, peaking above 10 microseconds, and blockage levels are still separated by about 1000pA. We see the emergence of a second population at 2000pA blockage, which simply indicates folding events, but they are a minority since 250-bp dsDNA is still fairly stiff.

Next, I used 1000-bp dsDNA
- 44nM 1000-bp dsDNA
- 6,681 events
- 6,084 successfully analyzed
- 552 too fast for good fit
- 45 miscellaneous analysis failures
- Average event rate (including analysis failures): 0.08 Hz/nM
- Events in plots restricted to having < 6 sublevels and max blockage less than 3nA (removes 39 events).
The seconds folding level is more pronounced, and the dwell time is extended again. Note that the peak dwell time is still shorter for 1000-bp dsDNA than it was for 50-nt ssDNA, even though this pore is smaller.
Finally, I added 10,000-bp dsDNA, and collected 14 events before it clogged permanently. Those events are also interesting, though. Most of them shows a very small folded level at the start, followed by a long unfolded tail, like so:
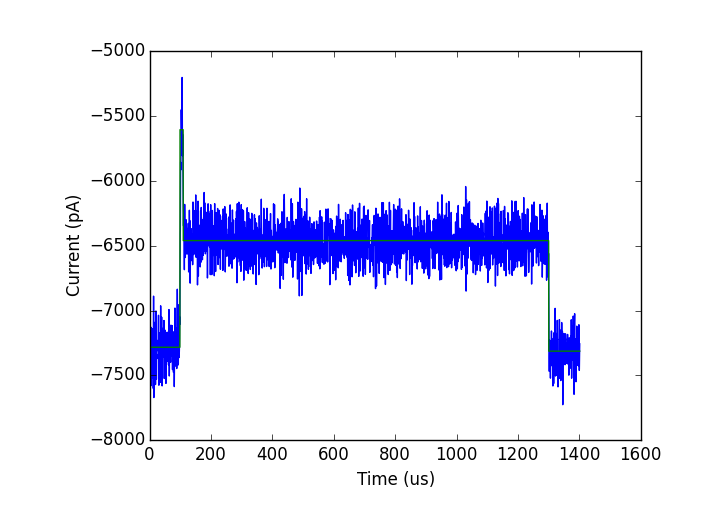
The scatter plot shows that the folded level is always much shorter than the unfolded one, and always occurs first:

While folds occurring first is generally true of more pores, I think the filter might amplify this effect. The idea is that part of the molecule goes through the filter, but 10kbp DNA is about 3.4 microns long, so most of it will still be outside the filter when the single pore captures it. While the single pore can capture the end in a folded state, it will quickly pull through and the filter will linearize the rest of the molecule. On the other hand, this molecule is also long enough that in theory both ends could feed through the filter and get captured by the pore, getting locked into a configuration where both ends are pulled on and no headway is made. So I suspect clogging will be a problem for molecules that are much longer than the intermembrane gap. The clogged state I observed happened around the -5500pA – -5000pA range, which is exactly the blockage level we see for folded dsDNA – suggesting that the clog is caused by a molecule which is captured from both ends through two different NPN filter holes.
For shorter molecules, I note that folds occur both at the start and at the end of events, rather than just the start. This is possible because the molecule can be completely inside the gap when it translocates, consistent with the explanation so far. This suggests that some interesting dynamics will occur when the molecule length is on the same order as the inter membrane gap (around 600-bp for this batch), that we will need to tailor the gap height to the molecule we want to study, and that we will probably get bad clogging if molecules are twice as long as the gap height.
Finally, it is interesting that I was able to get even 10-kbp DNA through the filter this time, whereas with the old batch of chips I struggled to see even 1kb molecules. I am wondering if it might be a consrequence of the SiN cap causing better adhesion and keeping the NPN membrane within the capture radius of the pore, whereas maybe when the SiN cap is not there, the membrane floats higher, causing less of a capture force to be present at the NPN layer. Repetition of these experiments will give us more information. The filter appears to not be very effective at filtering linear polymers, so when we actually use it as a filter, we will have to make sure our filter targets are globular or branched, though it is possible (and even likely) that with smaller NPN pores we would get better filtration even of linear polymers.
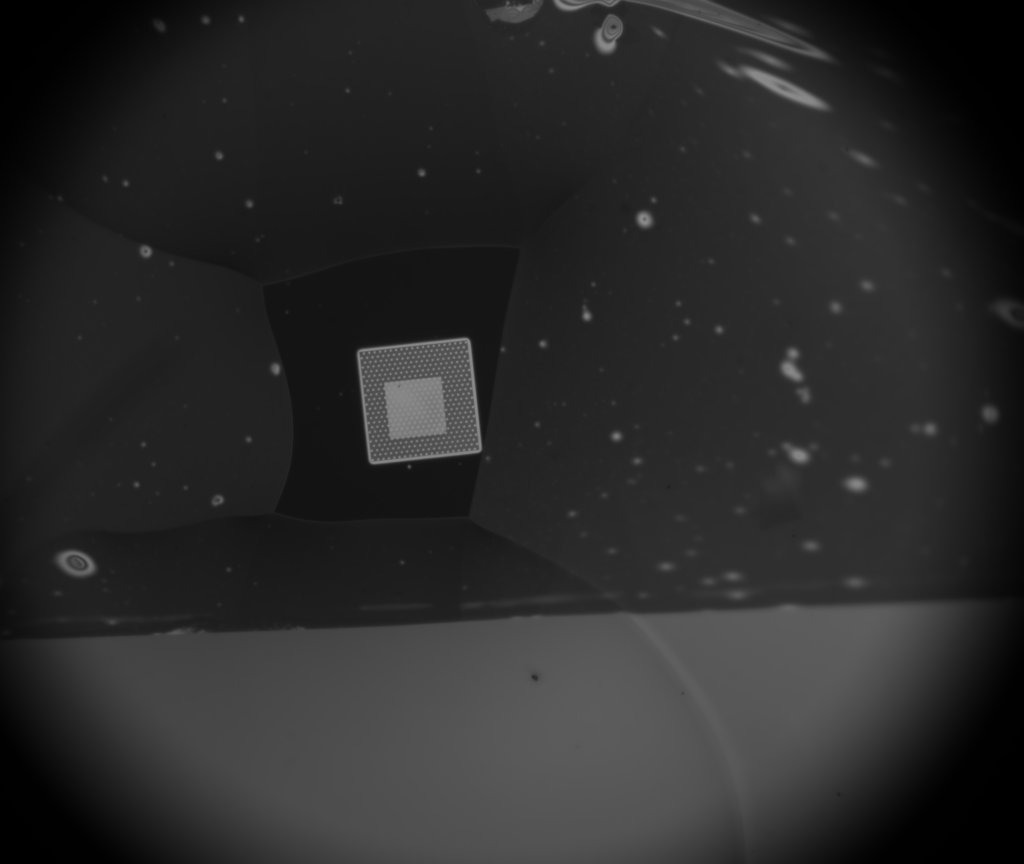
In both cases, the filter was verified to be intact before and after the experiment. You already saw images from the ssDNA experiment, and here are the images for the dsDNA one (after image first). There is some impingement of the solution under the PDMS, but the NPN appears to be well in contact by the darker color, so I think it is fine.

A final note for this update is the noise performance of the filters. With very few exceptions, the noise performance of pores made in chips with filters on them has been exceptional. For comparison, I include two PSDs below, one with (top) and one without (bottom) the filter, both painted with PDMS:
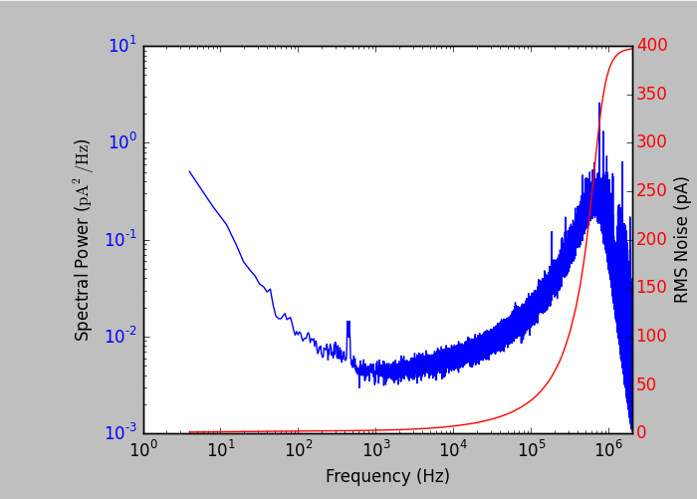
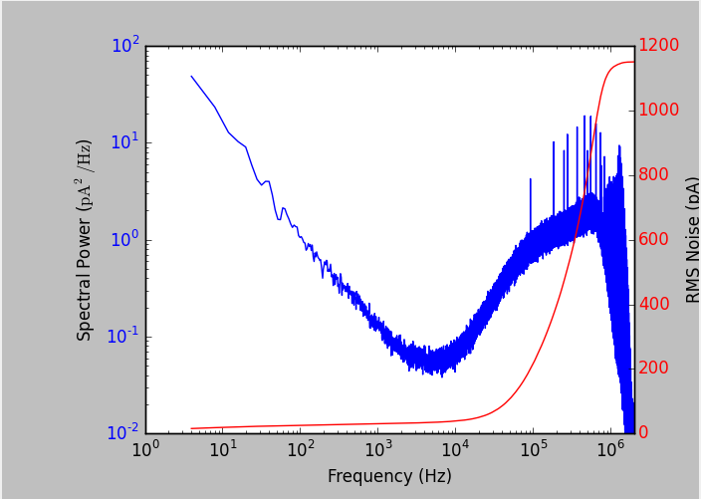
Ignore the low-frequency range, which is dominated by 1/f noise, and ignore the little spikes, which were a consequence of some other equipment that was on at the time. Note that the scale is a bit different (sorry about that). The important feature to note is the PSD in the range of 10kHz to 1MHz – the one with the filter in place, though otherwise the same, is significantly lower, indicating lower capacitance. I had not considered this before, but two membranes in series are basically two capacitors in series, which reduces the total system capacitance (1/C_total = 1/C_1 + 1/C_2). This (apparently) has the effect of reducing high-frequency noise to the point that I was able to perform the dsDNA analysis at a bandwidth of 750kHz (for comparison, the best I have ever heard actually being used in the literature is maybe 400kHz)! The other option is that the PDMS coverage was worse in one than the other, but visually they were basically the same, and I have noted generally good noise behavior when using filters so far.
The numbers are low, so all of this needs repeating, but there are lots of exciting things being suggested.
…And now for the bad news: my comprehensive PhD exam has been scheduled for some time in June. I am going to have to take a few weeks off to prepare for it, so this will be the last update until after the exam is done. I will be available via e-mail, and I hope to join Jim and Vincent via skype while Vincent is in Rochester to brainstorm over directions to take the project.After the exam, I will do nothing but filter experiments until we have a paper, and in the meantime, we can brainstorm and decide directions to take the project in light of the new information here.