Permeability Graphs for BSA Separations with Variable-Active-Area Sepcons Show Flow is Independent of Fractional Active Area
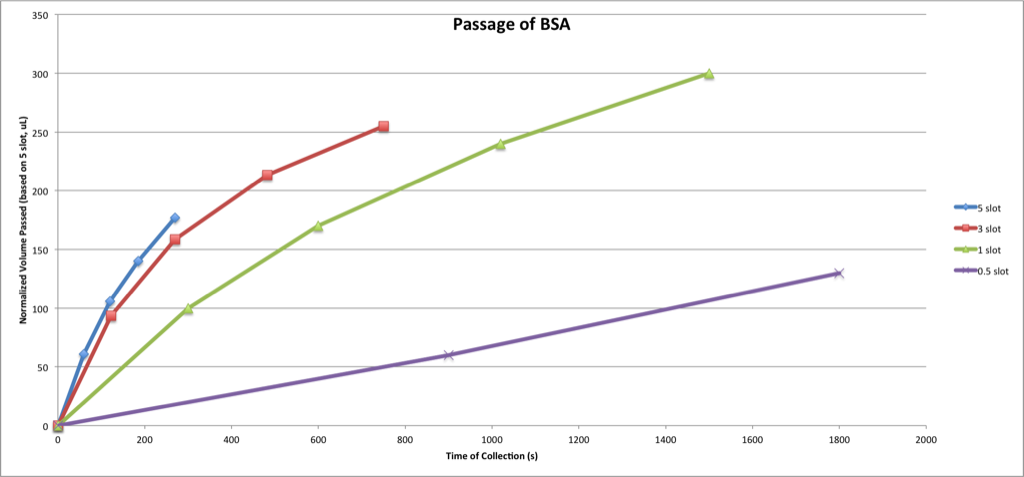
What I had in my two previous posts described as permeability graphs were in fact total volume passed/ total time passed graphs:
What I thought I saw was that cake layer formation was dependent on the filter geometry. There is some justification for such a dependence in the literature – These folks found that spacer placement in cross-flow filtration had a large impact on cake layer formation: Pressure, flow, and concentration profiles in open and spacer-filled membrane channels
Key figure from that paper:
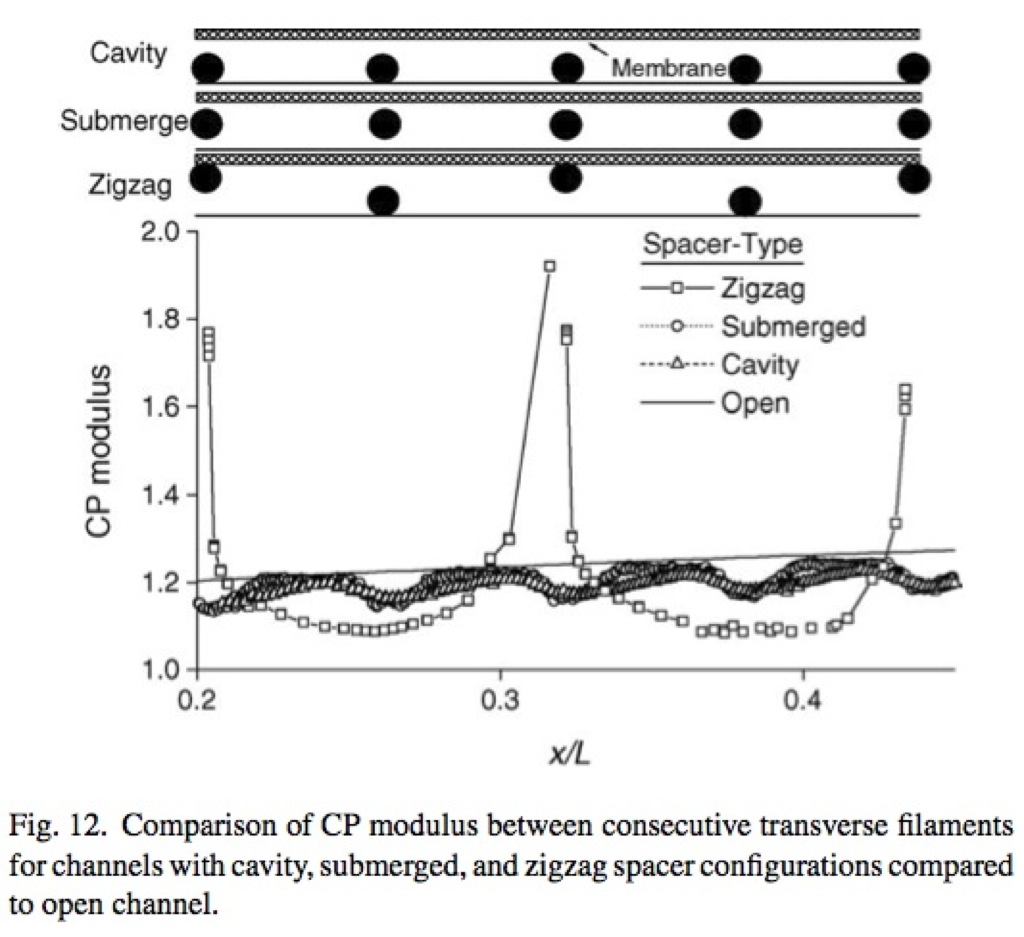
Where the CP modulus is a function of shear stress and indicative of cake layer formation.
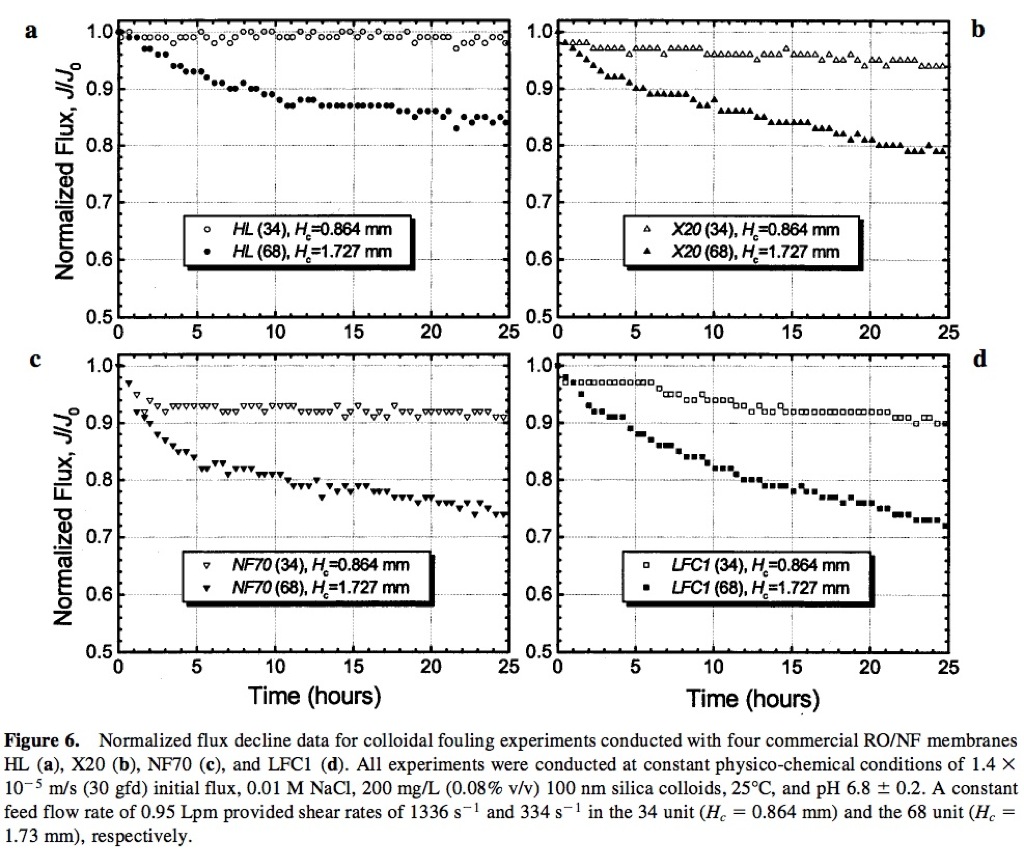
These folks: Influence of Crossflow Membrane Filter Geometry and Shear Rate on Colloidal Fouling in Reverse Osmosis and Nanofiltration Separations found that the height of a crossflow channel had an impact on cake formation, where thinner crossflow channels meant less cake formation.
Key figure from that paper:
I looked for papers dealing with geometric effects on dead-end filtration, but I found none. It seemed that if we could extrapolate between the two filtrations modes – cross-flow and dead-end – that the relatively smaller channel height of the higher active-area chips might mean that the 5-slot chips were slower to foul. Alas, this afternoon I plotted my data from the previous two separations as permeability graphs and the effect disappeared completely.
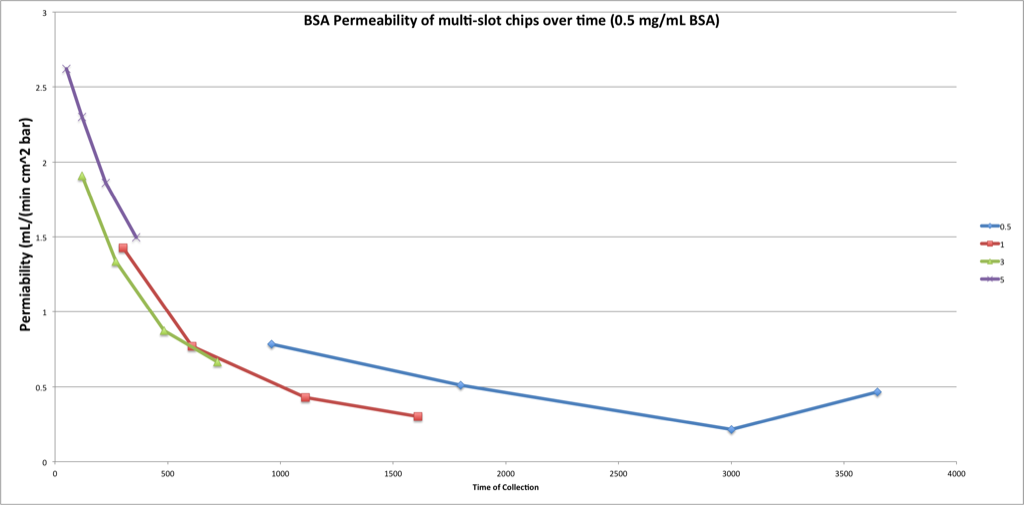
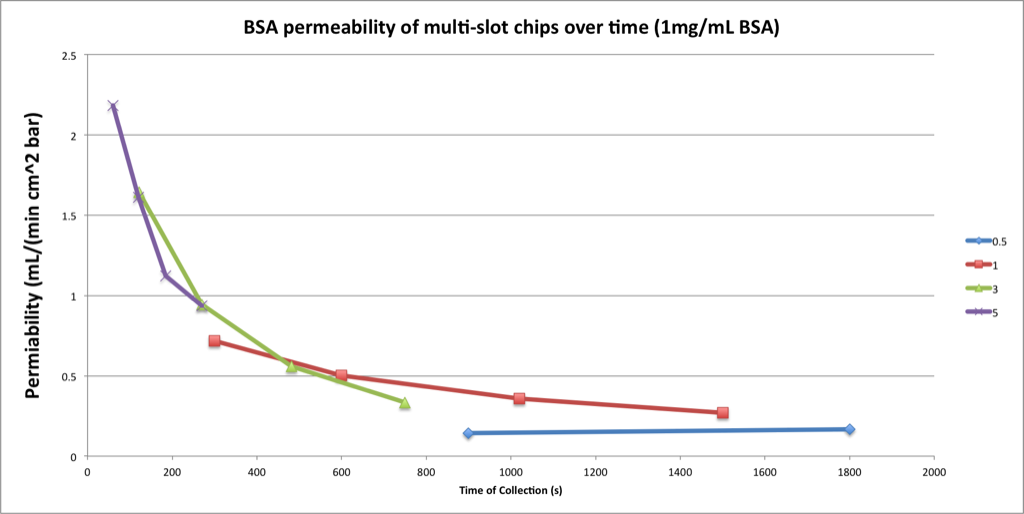
It turns out that though I had normalized for the difference in active area, I had failed to normalize the time as well. I’ve been thinking about why the time would need to be normalized all morning, and I still don’t have a firm grasp on that. Oh well.
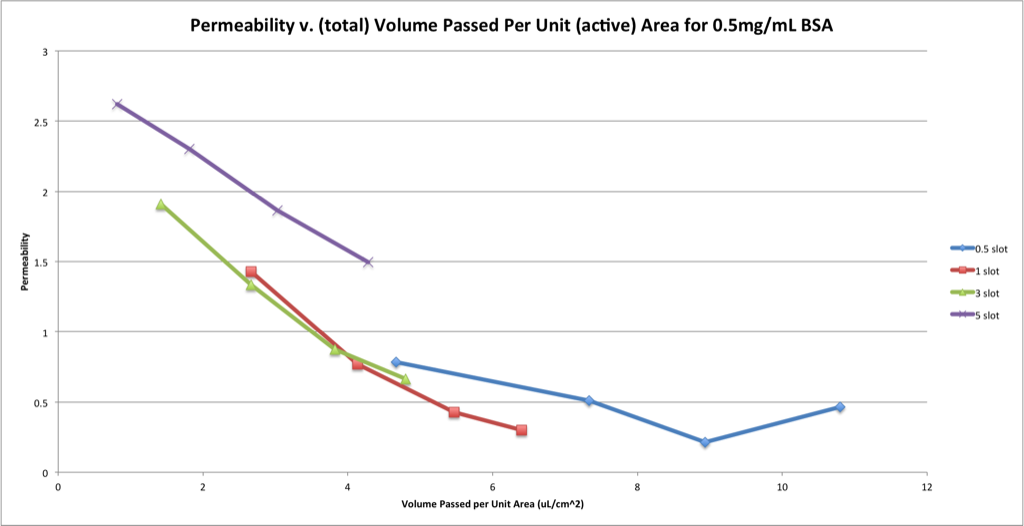
Here is a graph of permeability v. volume passed per unit active area:
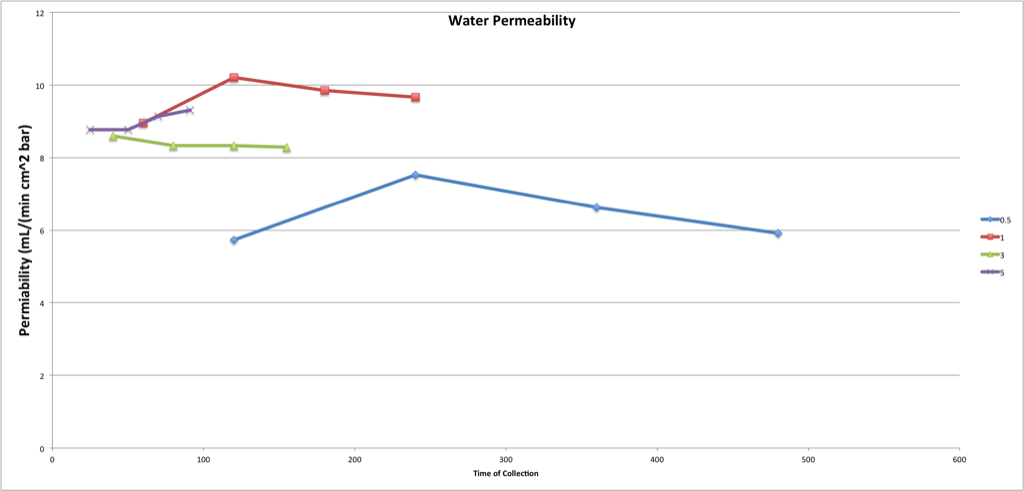
For what it’s worth, here are the permeability graphs for water and buffer:
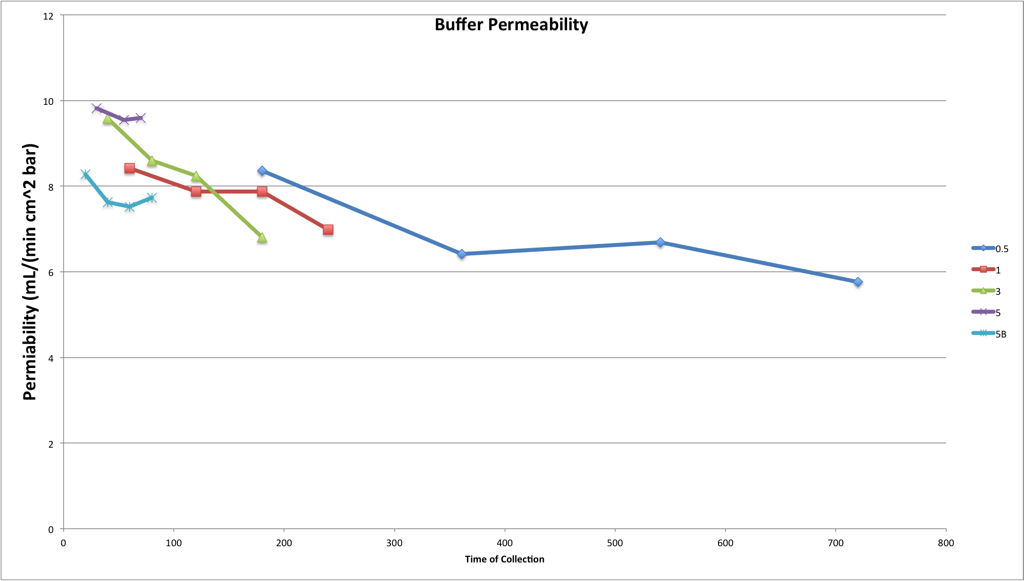
It’s interesting that there seems to be a general downward trend in Buffer permeability, but my guess is that that is non-physical.
Permeability not Permiability!
And Permeance is yet something different.
We should add a glossary of terms to this blog.
What is time normalized to?
Stupid excel and its lack of spell check!
When I say normalized I mean that I divide out the interval time out of the interval volume measurements.
So the units are volume/time? Time/volume? I like the permeability decay looking exponential, but I’m wondering if there is a physical meaning of this normalization on the x axis.
Permeability vs. volume passed per unit area would be meaningful to me …
but we should first see permeability vs. time (un-normalized) plots. Can you post those?