Separation Model Update
In the past couple of weeks I’ve tried a few more molecules to flesh out the experimental verification of the separations model. This is a quick update of the results. In the following figure, the blue line is the predicted sieving curve, the green line sieving given a no membrane/free diffusion situation, and the blue dots are the experimental results.
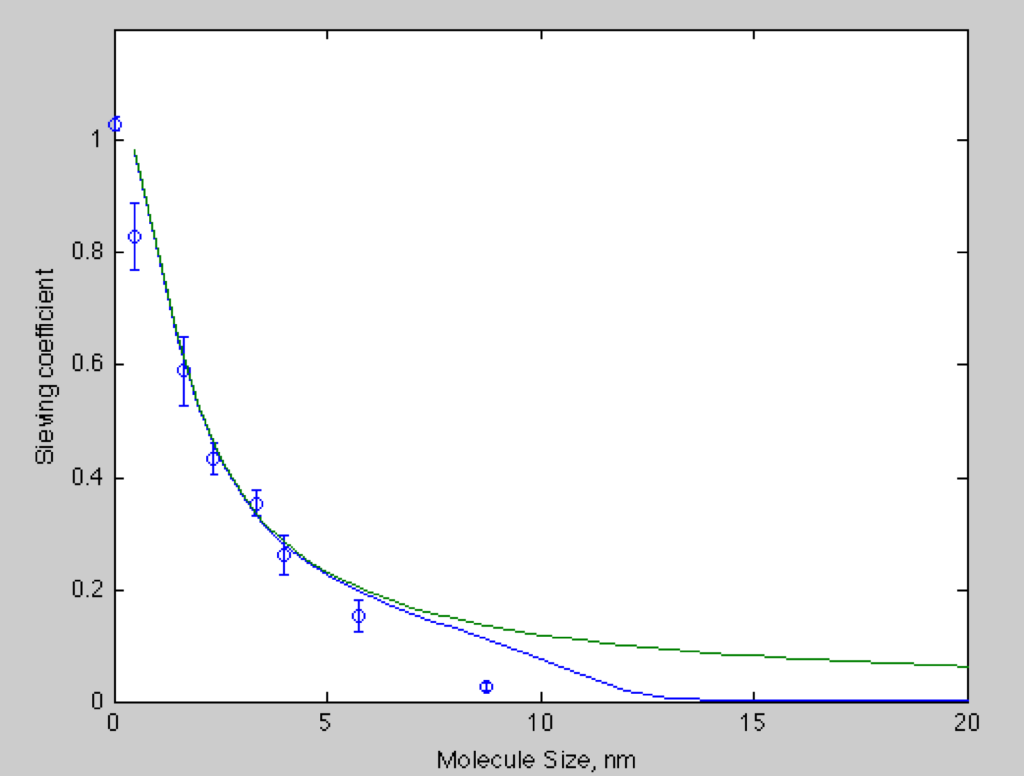
Cytochrome c (1.65 nm radius) fell right on the curve. H2O2 was measured using the Amplex Red kit, and fell slightly above a sieving coefficient of 1. This means that the filtrate was slightly higher in concentration than the retentate, which could be due to osmosis, evaporation, or error. However it’s still close to the expected value of 1 for a small molecule like this.
Rhodamine and FITC dyes fall beneath the curve slightly (rhodamine is plotted at .5 nm). It may be possible that there’s a problem with how the model predicts the diffusion when given a planar molecule like these, or there’s a high amount of adsorption or interaction between the molecules if the concentration is too high.
The two largest proteins still fall below the curve, and by adjusting the sizes of the pores for debye length or adsorption we can shift the blue curve lower in that area. The interesting thing here is that most of the molecules are diffusing just like free diffusion and as our model predicts, the membrane hardly affects the diffusion of these molecules.