Tecan sensitivity
I did a quick experiment in order to show everyone what the Tecan allows us to do. I made a dilution curve of rhodamine 6G in PBS and measured the absorbance and fluorescence with the fluorimeter.
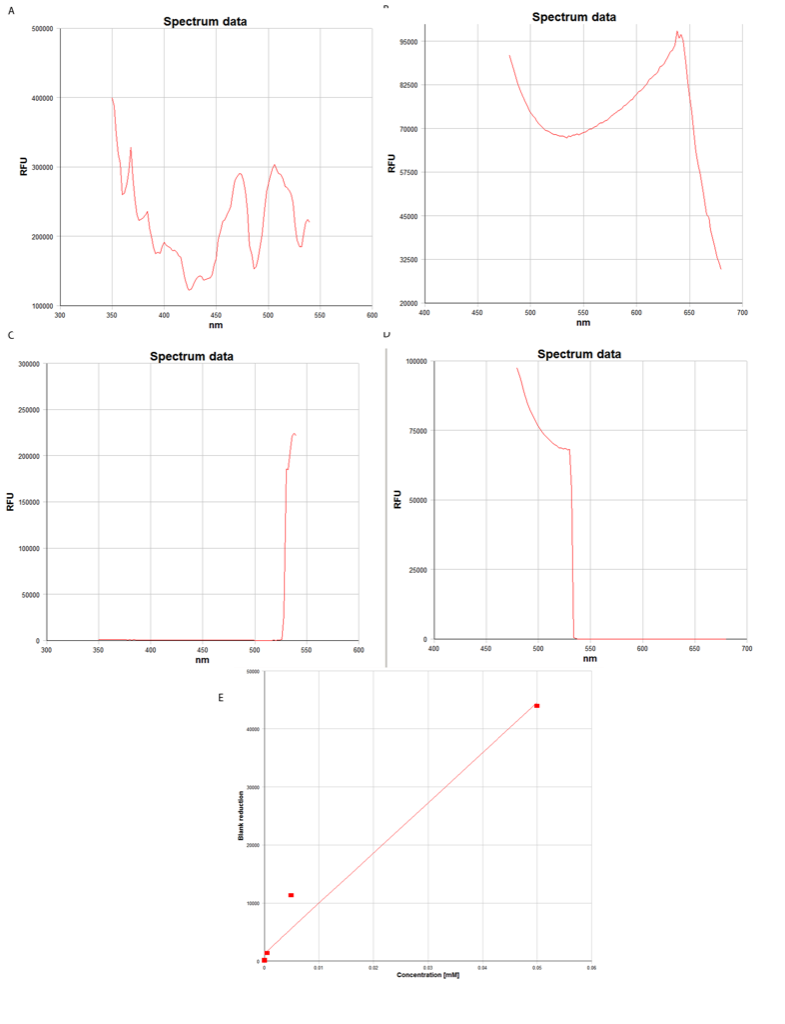
I first did an absorbance scan and found that the maximum absorbance was at 530nm (panel A). Then I i scanned the wells at 530nm and you can set up the program to give you a standard curve (panel B).

I then switched over to fluorescence mode. I first picked what I though was an appropriate emission and scanned through the excitation wavelengths (Panel A). I found that the maximum excitation was at 505nm. So then I dialed in the excitation to 505nm, scanned through the emission wavelengths and found the max emission at 637nm (panel B). I also scanned blank wells (panels C and D) to make sure that the plastic wasn’t contributing too much signal at the important wavelengths – it wasn’t. The standard curve is in panel E, which I found by setting the exc/em to 505nm/637nm.
This graph shows how much more sensitive fluorescence is compared to absorbance. I normalized the absorbance or fluorescence (RFU) values for each rhodamine concentration to the blank (PBS). Both axes are log scales. Even at the lowest rhodamine concentration (.5*10-7), the fluorescence value was ~15 times greater than the blank. Absorbance values didn’t increase significantly above the blank until ~ 0.5*10-3. This is about the same level Rachel found. The linear range of fluorescence detection extends at least 2 orders of magnitude lower than with absorbance.

I’m sold.