15nm oxide influence on air permeability
The graph below is air permeabilities for four samples from wafers 344,338,342,345 without and with 15 nm thick deposited oxide on the front side. All of this samples don’t have pinholes.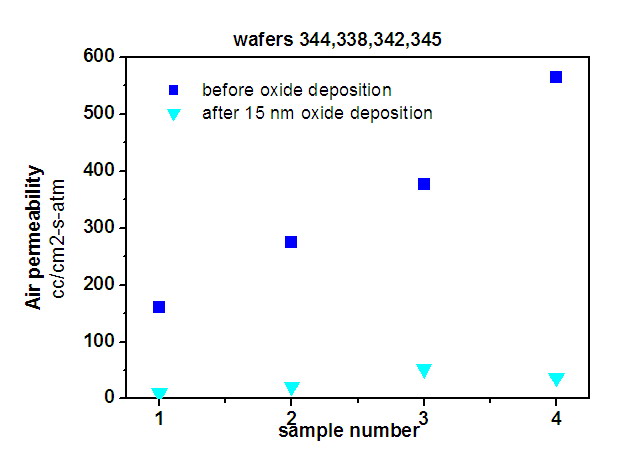
Look at the data for samples 2 and 4 on the graph. The approximate porosities of these samples are 2.7 and 4.6% which is the result of such difference in “no oxide” numbers. But after the oxide deposition the numbers are very close and it means that the porosity is the same and pores that are smaller are not there anymore.
These results gave me an idea that this kind of experiment can be very informative for experimental pore size distribution determination.
For example, depositing different oxide thicknesses on few samples from one wafer or depositing layers on one sample and then measuring their permeabilities will give information what pores there are.
.