DNA Filtration Part 2
Since the last post we have been working on obtaining replicates with wafer 101 chips. The goal was to show salt dependent filtration changes. These chips were different from the ones originally used in that the pores were much smaller (7-15nm diameter) and did not exhibit any merging. It was suggested that we perform an ozone treatment on the chips before running filtration experiments, and we did initially. For each experiment a 10 base pair (bp) DNA ladder was used. This ladder contained bands starting at 10 bp and ending at 330 bp in 10 bp increments. After filtration, the filtrate and retentate were run on a 4% agarose gel and imaged with SYBR Gold. We switched to SYBR Gold because we believed that it bound tighter to DNA and had a higher fluorescent yield.
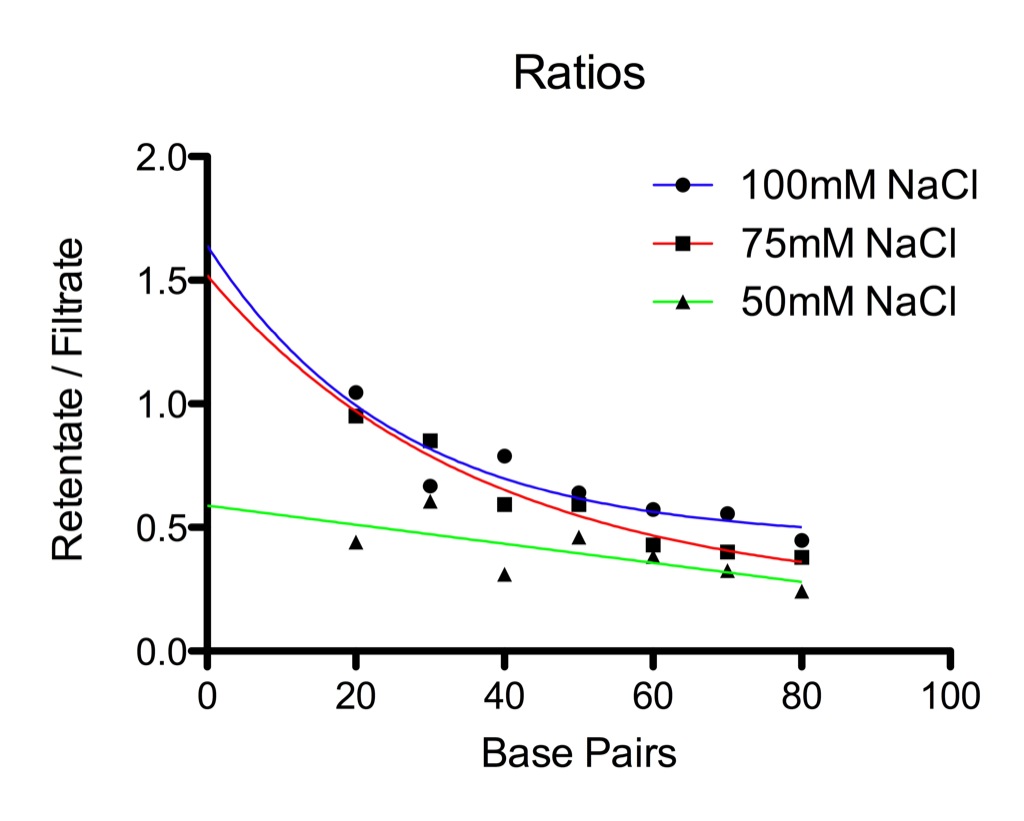
Ozone treatments on the chips initially yielded problems. It was concluded that polymers were being deposited on the membranes, obscuring pores and blocking diffusion. Steps were taken to correct this and Sepcons were used to mount the chips instead of our old block design. At this point, I was seeing large DNA segments diffusing through the membrane even at lower salt concentrations (50mM NaCl). We realized that I had been making an error in my setup in which salt concentration in the filtrate was twice that of the salt concentration in the retentate. This problem was less pronounced in previous experiments because less ladder was used, thus reducing the salt differential. We have concluded that a salt differential across the membrane creates an entropic gradient across the membrane, resulting in osmotic flow. While this was created in error, we believe that this will be behavior worth exploring in future studies. The results from filtrations with osmotic flow are provided in the first figure.

- For each data set, salt concentration in the retentate was half of that stated in the legend.
After correcting for this, I ran four replicates and generated similar curves. This time no ozone treatment was performed and we used our old Teflon reservoir blocks. Equilibration time was 72 hours. These conditions remained the same for each replicate. This time the difference in filtration behavior is apparent. I was able to block integrate heavier bands. The base pair values reported for points higher than 100 bp are averages of a block of bands. This was done out of necessity since the higher molecular weight bands are to close together to distinguish. The 10 bp band was not integrated because it runs off of the gel. The results from this study are provided in the following figure.
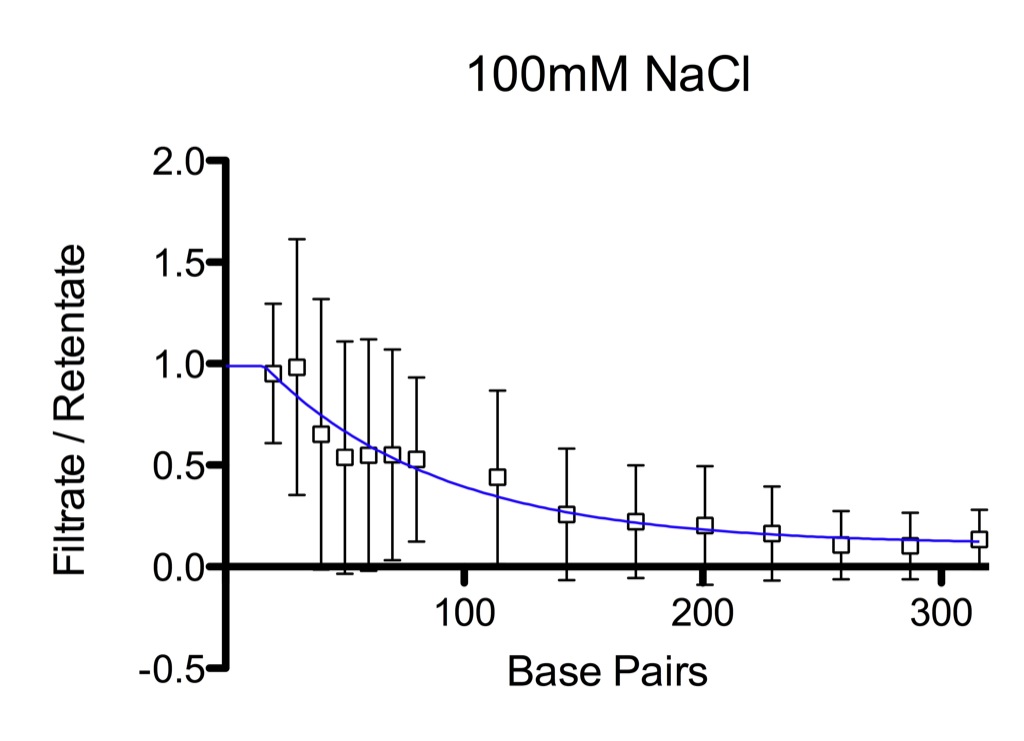
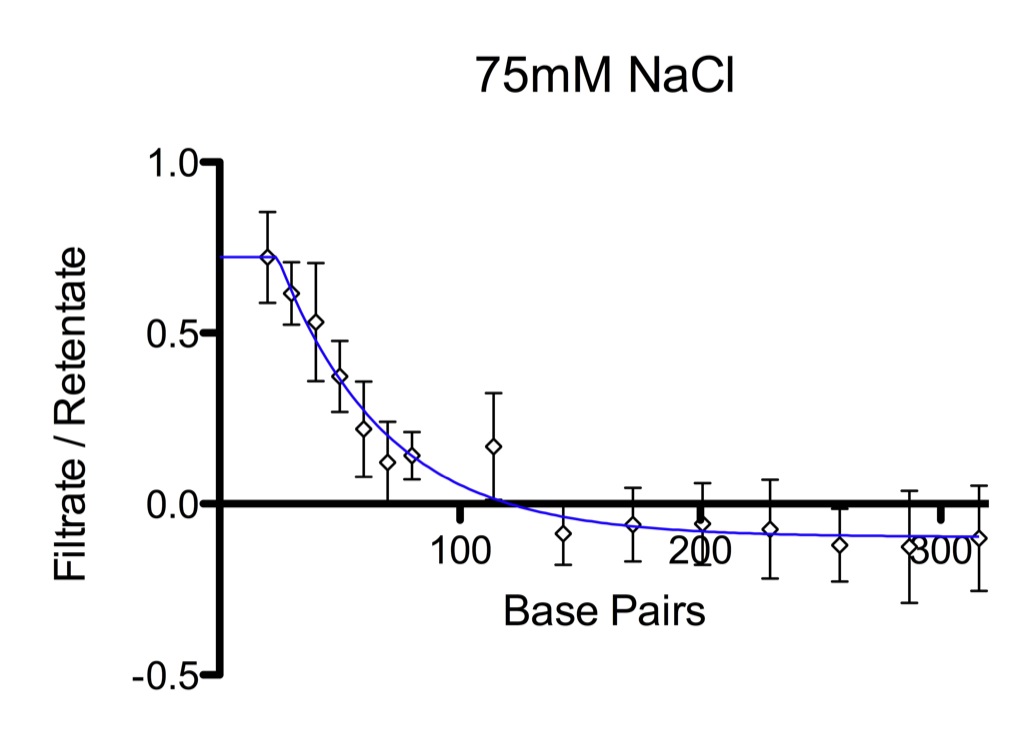
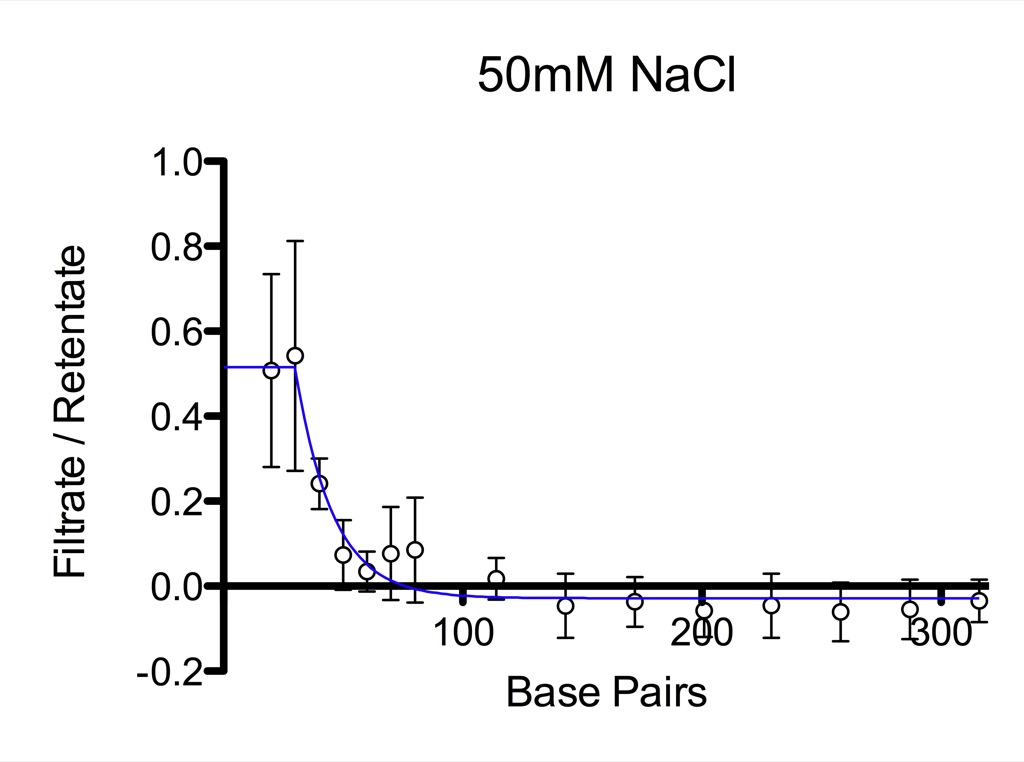
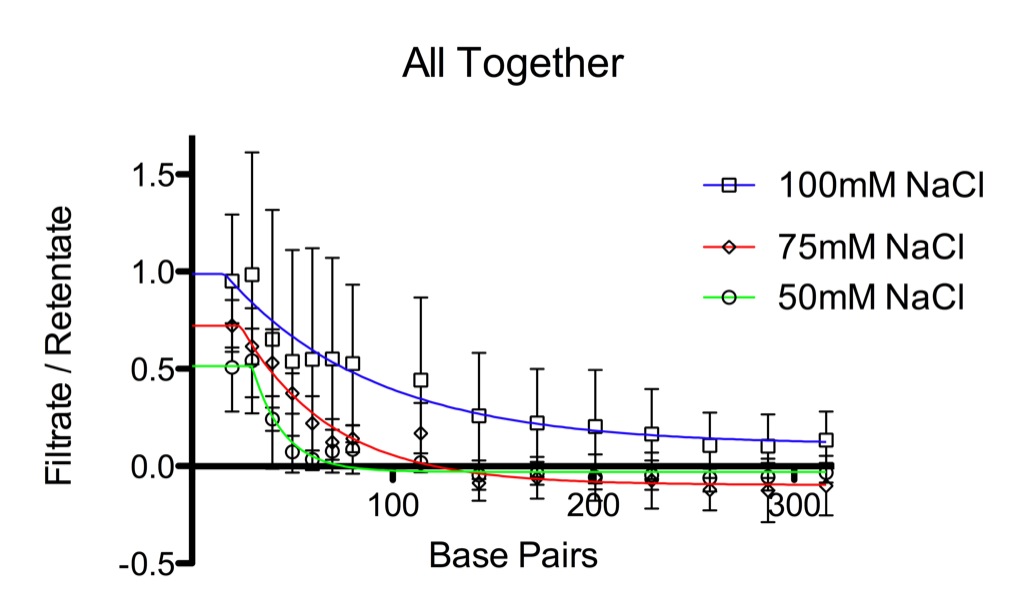
High error values indicate a large chip-to-chip variability. You will notice that the error bars decreased as salt concentration was decreased. 1/e values for the exponential decay with plateau fits are 74, 45, and 16 bp for 100mM, 75mM and 50mM NaCl respectively. R2 values for the average curves are not very favorable, but the same parameter for each individual experiment never dips below 0.8. I believe this is another indication of chip-to-chip variability. Finally, it would appear that lowering salt concentration also increases equilibrium time. 100mM filtrations have equilibrated at the lowest mw bands but 50mM filtrations have not. We plan to move away from the 10bp ladder and use oligomers of designed size and base composition.
We have some ideas on how to explain our findings to date. In the experiments done in the presence of flow induced by osmotic pressure, DNA of all sizes pass through the filters, even at the lowest NaCl concentration (50 mM). Once I corrected my procedure so that the NaCl concentration was the same on both sides of the membrane, the permeability of DNA > ~100 bp drops to zero for the lower NaCl (50-75 mM). We think it possible that, under conditions dominated by diffusion, permeability will be governed by the dynamic radius of the DNA (effectively its length) and pore size. But any flow, even if it is random flow with a net flow of zero, will pull the DNA through the pores like pulling thread through a needle.
We would like to discuss this at an up coming meeting, perhaps this coming Tuesday, if there is time available?
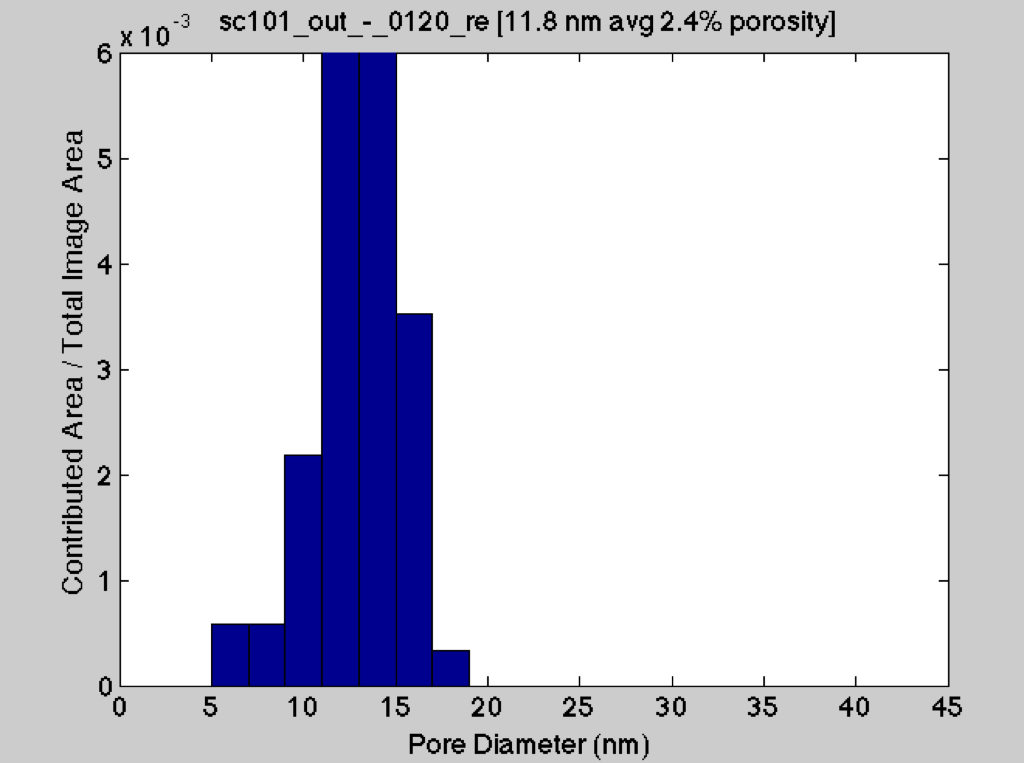
Added: Pore histograms of outer and internal chips.
Outer:
Internal:
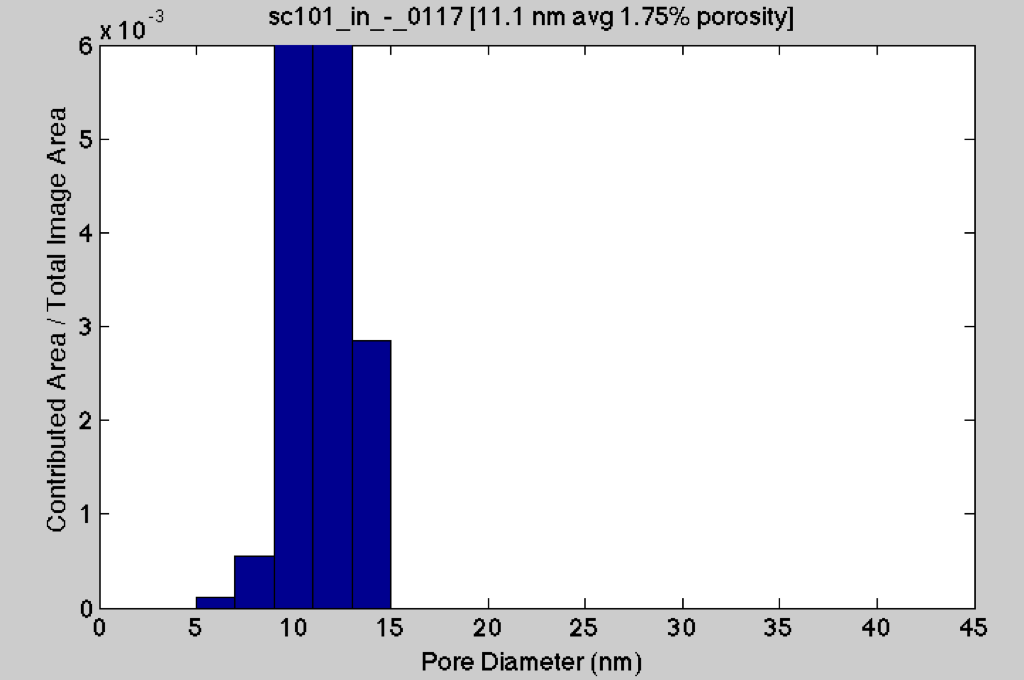
I appended some histograms to the bottom of your post. There is a slight difference between outer and inner chips on this wafer. Outer chips have a few bigger pores and a higher porosity. This may count for some of the error in the replicates, but it is interesting that the lower salt concentration trials had less error. Did you keep an eye on the coordinates of every chip?
If in the lower salt concentration trials you are closing all pores except for only the biggest ones, then maybe any benefits from higher porosities on the outer chips would be canceled out.
I regret to say that I did not keep good track of the coordinates. I cannot determine if that was the main source of variability. I can say that the variability is so drastic in some cases that I doubt slightly larger pores can explain it. If you would like, I can bring all of my data to the meeting so you can get the whole picture.
Thanks Paul – please do come to the meeting on Tuesday to present this post.