Updated Rhodamine Dilution
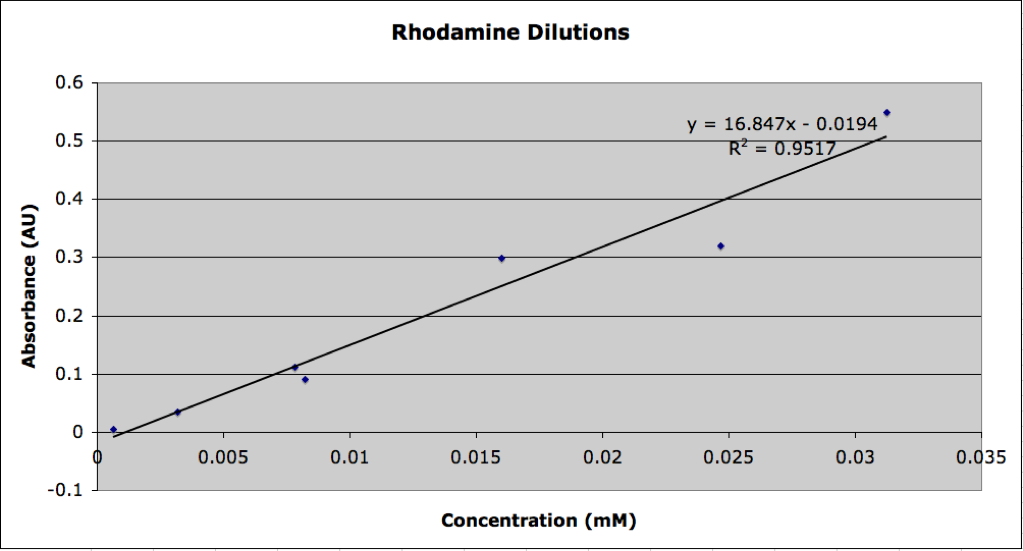
I fixed the graph for the serial dilution of Rhodamine that I did last week and removed all absorbency values that were greater than 1.08 AU. The graph looks much more linear now with an R^2 value of .9517
I fixed the graph for the serial dilution of Rhodamine that I did last week and removed all absorbency values that were greater than 1.08 AU. The graph looks much more linear now with an R^2 value of .9517
Introduction Sepsis is a maladaptive response to infection with a 25-50% mortality rate and a high incidence of cognitive decline among sepsis survivors.1-6 Because infection originates outside the brain, the factors responsible for cognitive decline in sepsis must get to the brain through the circulation and breach/act on the blood-brain barrier (BBB) to cause injury.7-9…
Time lapse movie of fibroblast spreading on the nanomembrane was captured over a period of ~ 8 hours. I was having some problem uploading the video here, thus have done so in the NRG knowledge page under the cell culture manuscript.
Today I etched wafer 621, which is the pair to 620. While w620 has a relatively low pinhole density, w621 shows a much higher occurence of defects. Since the front-end processing and thermal treatment was identical for these wafers, I believe that the variability lies in the etch process. Looking at the two wafers side-by-side,…
Purpose: Study the hemocompatibility of different substrates using platelet activation as the indicator. Extraction of platelet rich plasma (PRP): PRP were prepared from whole blood following the standard protocol outlined by Abcam (http://www.abcam.com/protocols/isolation-of-human-platelets-from-whole-blood). To describe briefly, 9 mL whole blood was centrifuged at 200g for 20 minutes in a 15 mL Falcon tube to obtain…
Introduction Permeable membranes provide a physiologically relevant cell culture substrate for in vitro study of barrier cell types, such as endothelial cells, which assume a polarized morphology with distinct apical and basolateral surfaces. Cell morphology and subsequent monolayer formation and barrier function are largely dependent on initial interactions with the cell culture substrate via focal adhesions….
This post is a brief update on the previous post of HUVEC migration on 0.5 μm porous substrates. Brief Recap We compared cell migration on nonporous (np), 0.5 μm low porosity, and 0.5 μm high porosity SiO2 membranes. Low and high porosity refer to a center-to-center distance of two or three pore diameters, respectively. For…
What is the absorbance wavelength you are measuring?
The wavelength is measured at 530nm. I checked online and it said that the maximum absobtion of rhodamine is about 530nm.
This looks OK, but I’m still surprised that the data points are not tighter to the line (lower variance). This is close to an ideal system, so I would suggest trying to perfect your technique to get this rock-solid before advancing to more complicated experiments. If you try to measure the same sample multiple times, does the value jump up/down around the line? If so, maybe an averaging is needed?
If you think this is good enough for your purposes, that’s fine too, but you want to make sure that this measurement error is not a significant contributor to the overall experimental error. You should also consider the range of absorbance values that you will typically be using, and confirm accuracy in that regime.
I ran two measurements for each sample and then averaged the two measurements. I’ll run the experiment again on Monday and see if I can get a better fit.
How close were the two measurements for each sample? If each set of two is tight, then the variability is not in the measurement, but the prep. Once you isolate the source of variability, you will probably be able to get nice looking data with a few tweaks of procedure. Even if the variability is outside of your control, it’s still important to understand it for experimental design.