f-BSA adsorption pnc-Si
Samples of pnc-Si, 5.5 mm x 5.5 mm, were functionalized at Adarza and incubated with fluorescein conjugated BSA. Wells were formed in PDMS to hole fluid above the samples. Samples were wetted with PBS then f-BSA, 5 mg/mL, was added. The samples were placed in petri dishes with DI water soaked Kim wipes; the petri dishes were wrapped in parafilm then placed in the refrigerator overnight. Before viewing, the samples were rinsed in PBS to wash away any free f-BSA. The samples were dried with N2 then inverted onto a clean microscope slide. Images were taken on the inverted fluorescence microscope and measured with ImageJ for intensity.
Figure 1 compares the results, pnc-Si 1, pnc-Si 2, and pnc-Si 3 are the samples prepared by Adarza. These samples had been used in a previous experiment which did not yield results, possibly due to the low level of f-BSA used, 1 mg/mL.
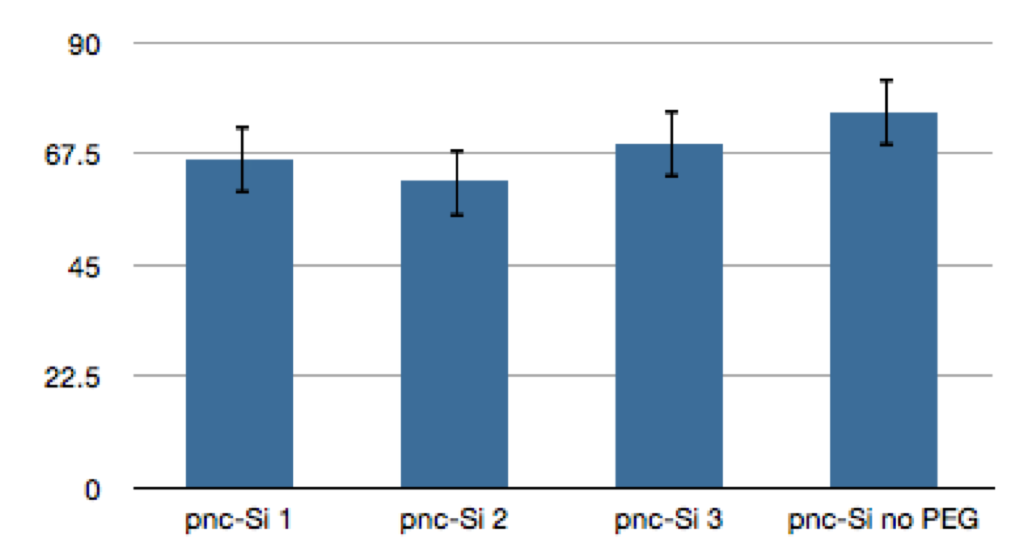

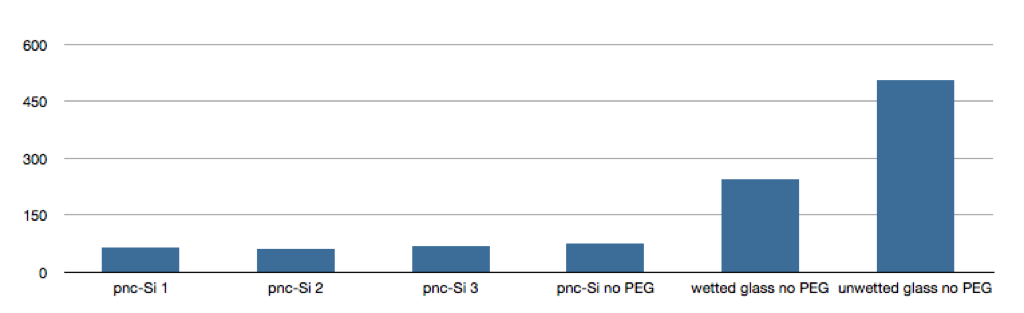
Figure 3 shows the same data along with the data for bare glass slides, one which was wetted with PBS, the other which was not.
There is a big difference between the pre-wetted and dry surfaces regarding BSA adsorption. There is also a great deal of difference between the glass slides, and all of the pnc-Si chips even though not all of the chips were functionalized. This may, in part, be due to the fact that the functionalized chips had previously been used in the earlier 1-mg/mL BSA experiment. There is a much higher standard deviation for the unwetted surface of the glass slide (~57). This points to the variability of the dry surface adsorption, in addition to the
I’m not clear one all the details of this experiment, so I have a couple questions/suggestions:
1) During the overnight in the fridge, was there agitation? The incubation conditions should mimic your ultimate application, so if it is dialysis, I would think that static exposure is a bad idea as this makes a huge difference for protein adsorption to a surface. In the protein assay business, there is no such thing as an overnight static process, as this leads to nonuniformity and diffusion issues. Just a thought.
2) Was the a control sample with untreated pns-Si exposed to f-BSA? I thought you mentioned that the control was not exposed to the f-BSA?
3) Your result with the wet vs. dry slide is what I would expect. I assume you could see some interesting patterns in the dry application? Rings, lines, or globs? These features most likely form the instant the f-BSA is applied.
I’ll try to get you more treated samples next week. Thanks!
1) No agitation. Thanks
2) The only measurement taken without f-BSA was the a glass slide. It was this unexposed glass that was used as the background measurement.
3) I did indeed see some very interesting patterns.