Collagen IV deposition by hCMEC/D3 (endothelial cell) and HBVP (pericyte) co-cultures in the μSiM-hNVU
Note: A postscript regarding a gelatin assay to determine MMP-9 activity was added to this post on Feb 25, 2021.
Introduction
The blood-brain barrier (BBB) plays an important role in maintaining brain chemistry by restricting the permeability of undesirable small molecules and cells. Inflammatory diseases may disrupt the BBB and promote the development of neurological disorders [1]. One of the potential mechanisms of BBB disruption is the degradation of the extracellular matrix proteins that make up the endothelial basement membrane (BM). The BM is composed primarily of collagen IV and laminin networks that are linked by nidogen, perlecan, and heparan sulfate proteoglycans [2]. These proteins provide a support structure for endothelial cells, and it is believed that cellular adhesion to collagen IV is part of a pathway responsible for upregulation of the tight junction protein claudin-5 [3]. The tight junctions are the key to limiting endothelial permeability, since they restrict paracellular migration of small molecules. Thus, the BM helps maintain the barrier function of the BBB in two ways: its networks act as physical impediments to molecular diffusion, and they help sustain tight junctions. BM proteins are degraded by matrix metalloproteinase-9 (MMP-9, also known as Type IV Collagenase or Gelatinase B), which is a product of pathways initiated by pro-inflammatory signals such as tumor necrosis factor-α [4]. This could be an important link between inflammation and BBB disruption.
I have been working towards detection of BM protein components in an in vitro model of the BBB, as well as quantification of changes in these proteins. Previously, I examined collagen IV production by Human Umbilical Vein Endothelial Cells (HUVECs) in monoculture and in co-culture with Human Dermal Fibroblasts and also attempted to determine whether treatment with MMP-9 would have a measurable effect on the appearance of collagen IV in my fluorescence images. I also took z-stacks on a fluorescence microscope to ascertain if the collagen IV was deposited exclusively on the basal side of the HUVECs, which would mimic the physiological orientation of the BM. While HUVECs and fibroblasts were useful for piloting some of my assays, they are not appropriate cell types for modeling the BBB. I transitioned to working with human Cerebral Microvascular Endothelial Cells (hCMEC/D3; Sigma-Aldrich cat. no. SCC066) and primary Human Brain Vascular Pericytes (HBVPs; ScienCell cat. no. 1200) and seeded them on either side of the 100 μm-thick membrane in the μSiM device to simulate the close physical proximity of these cell types in the brain vasculature.
Co-culture seeding optimization
For a thorough investigation of the same issue, please see Molly’s recent post.
My plan was to grow the hCMEC/D3s in the top well of the μSiM device with the HBVPs in “direct” co-culture on the underside of the membrane. In order to do so, I followed the seeding protocols for bottom channel culturing and hCMEC/D3 culturing. Briefly, the bottom channel was coated with 2 μg/cm2 poly-L-lysine (ScienCell cat. no. 0403) solution for 1 hr prior to seeding HBVPs. Due to low cell recovery prior to my initial co-culture experiment, the HBVPs were seeded at a density of 24,000 cells/cm2 rather than the recommended density of 40,000 cells/cm2. 80 μl of media was added to the top well and the devices were inverted and placed in the incubator (37°C , 5% CO2) for at least 2 hr. However, upon inspection it became clear that few HBVPs had successfully attached to the underside of the membrane (Fig. 1A). The majority of cells in the devices had adhered to the bottom of the lower channel (Fig. 1B).

Afterward, I addressed the low cell seeding density issue by simply maintaining more flasks of HBVPs and concentrating the cells after passaging. To ensure that the cells adhered exclusively to the underside of the μSiM membrane, I followed Molly’s advice and applied a pre-coat of poly-L-lysine to the membrane chips prior to device assembly. Briefly, a rectangular silicone gasket ~630 μm thick with a central cutout was manufactured using a craft cutter. This silicone gasket was placed in a petri dish, and membrane chips were placed trench-up on top of the gasket such that the membrane surface remained in contact with the air (Fig. 2A). The membranes were sterilized under UV for 20 min prior to application of a 50 μl droplet of poly-L-lysine. Membranes were incubated in this manner either in the incubator for 1 hr or in our 4°C refrigerator overnight. Following incubation, the poly-L-lysine coating was aspirated and the membranes were rinsed twice with autoclaved water. The membranes were then placed in the full μSiM housing and sterilized again under UV for 20 min. A 25 µg/cm2 collagen I (Sigma-Aldrich cat. no. C3867) and 5 µg/cm2 fibronectin coating solution was applied to the top well for at least 1 hr to later promote hCMEC/D3 adhesion. Then, the top well was filled with 80 μl of media and HBVPs were seeded in the lower channel at 40,000 cells/cm2. The devices were inverted and incubated for at least 2 hr. HBVP adhesion demonstrated marked improvement, with many cells attached to the underside of the membrane (Fig. 2B) and few or no cells on the bottom of the lower channel (Fig. 2C). Continued inspection in the days following seeding demonstrated that this trend continued for at least 1 week of culture in the devices. hCMEC/D3s were seeded in the top well 1-2 days after HBVP seeding, depending on availability. The hCMEC/D3s generally did not have difficulty growing in the devices.

The relative position of collagen IV
In my earlier work with HUVECs, there had been a question as to whether the collagen IV was deposited below the endothelial cells in a manner that would mimic the position of the basement membrane. In order to examine the relative position of the hCMEC/D3 cells to collagen IV, I planned to reconstruct 3D images after taking z-stacks with RIT’s confocal microscope. I stained the hCMEC/D3 cells in a co-culture device with anti-CD144 (VE-cadherin) monoclonal antibody conjugated to phycoerythrin (Life Technologies cat. no. A18353) in the hopes that it would be possible to identify the endothelial cells by their characteristic tight junctions. Unfortunately, the anti-collagen IV monoclonal antibody conjugated to Alexa 647 unexpectedly bled into the same fluorescence channel as the CD144 stain, making it difficult to distinguish between the two. I was able to identify CD144 based on the characteristic shape of the endothelial tight junctions, and I noticed that it came into focus on our lab’s widefield microscope at a higher z-position compared to the collagen IV fibers (Fig. 3). This potentially supported the expectation that collagen IV was deposited below the endothelial cell layer.

In an effort to resolve the hCMEC/D3 tight junctions in a separate fluorescence channel, I also attempted staining with an anti-ZO-1 monoclonal antibody conjugated to Alexa 488 (Invitrogen cat. no. 339188). This was not successful due to a high signal-to-noise ratio in the GFP fluorescence channel. When preparing the samples for imaging on RIT’s confocal, neither the ZO-1 nor the CD144 stain could be observed. It is possible that both had a poor signal-to-noise ratio or that they photobleached too quickly to be of practical use for confocal microscopy. As such, the only indicator of the relative cell position to the collagen IV were the DAPI-stained nuclei. Z-stacks were taken on the confocal microscope, revealing that collagen IV was sandwiched between two cell layers (Fig. 4). This makes sense, since we would expect the collagen IV to lie on the membrane in between the hCMEC/D3 cells and the HBVPs.

Human brain vascular pericytes may contribute the majority of collagen IV fibers in μSiM co-cultures
Prior to staining μSiM co-cultures, I tested the collagen IV stain on two different types of hCMEC/D3 monocultures. One type was grown in the μSiM device for only 4 days prior to staining in an effort to see if I could decrease culture times for my experiments. Rather than collagen IV fibers, I observed bright fluorescence localized to the same regions as the cell nuclei (Fig. 5A). Due to the lack of apparent basement membrane, I concluded that either hCMEC/D3s required more than 4 days of culture to produce collagen IV or that hCMEC/D3s monocultures simply do not form significant quantities of collagen IV. My second monoculture test consisted of hCMEC/D3s grown in a 24-well plate for 9 days prior to staining. The anti-collagen IV stain had a much lower signal compared to some of my previous experiments with HUVECs, but I was still able to image large quantities of collagen IV (Fig. 5B). This indicated that the hCMEC/D3s do produce collagen IV, but that they either require a longer culture period than 4 days or have a preferred substrate (tissue culture plastic, in this case).

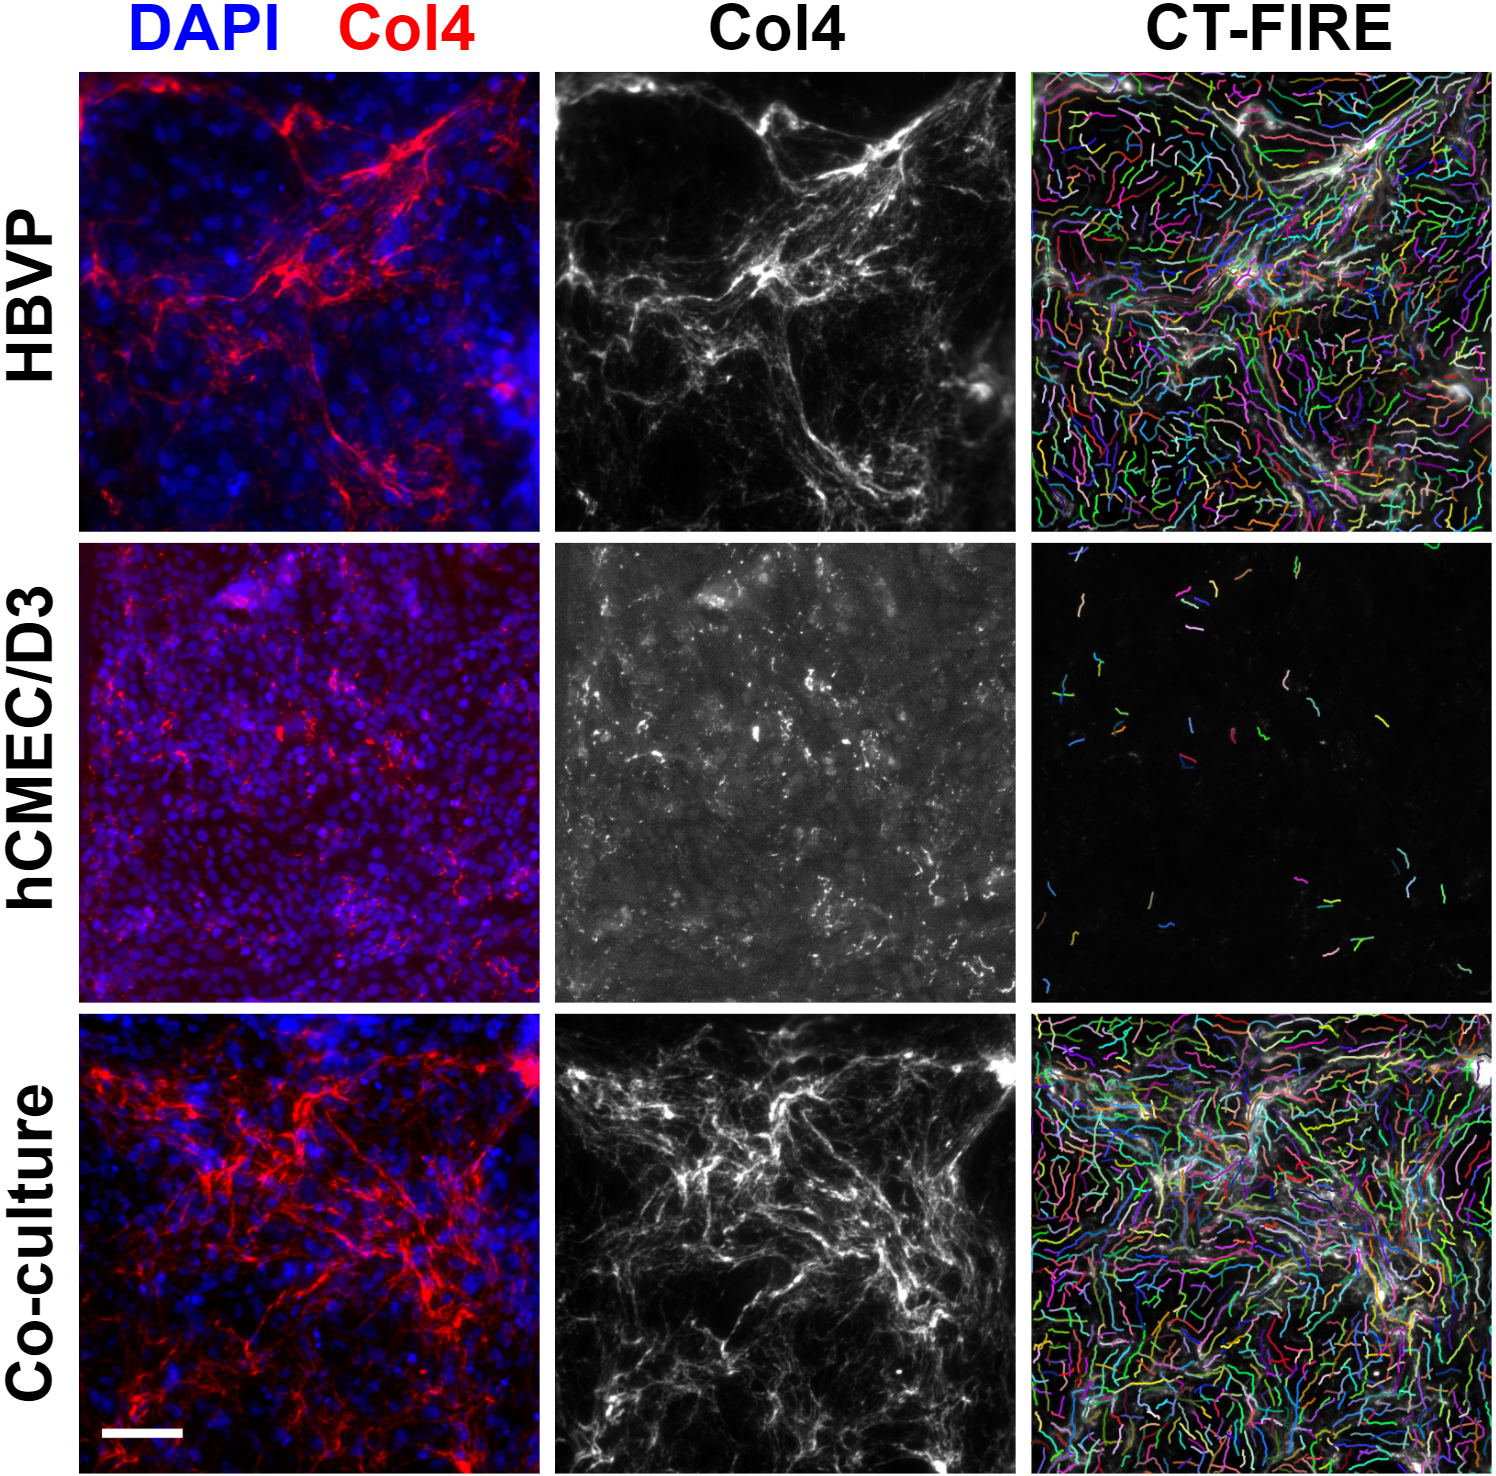
μSiMs were pre-coated with poly-L-lysine and collagen I + fibronectin as described above, and were seeded with HBVPs followed by hCMEC/D3s a day later. They were maintained in both monoculture and co-culture for 6 days prior to fixation and staining for collagen IV. Very few collagen IV fibers were observed in the hCMEC/D3 monocultures (Fig. 6). This was consistent with the earlier monocultures that had only been grown for 4 days. Conversely, HBVP monocultures demonstrated good collagen IV fiber deposition that appeared similar to the amounts of collagen IV produced by co-cultures (Fig. 6). In order to analyze the fibers, I utilized the publicly available CT-FIRE software v2.0 (University of Wisconsin-Madison, Laboratory for Optical and Computational Instrumentation). The software is able to extract fibers after applying the fast discrete curvelet transform [5]. Examples of the results from the fiber extraction algorithm are presented in figure 6. As a control, I also took images of μSiMs without cells. After adjusting CT-FIRE’s thresh_im2 parameter to 100, the program detected fewer than 5 fibers in the control images (data not shown) whereas hundreds of fibers were typically identified in images derived from μSiMs with cells.

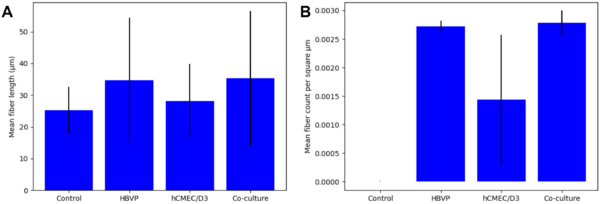
CT-FIRE outputs fiber data including the total number of fibers and length of the individual fibers, and I used this to make a comparison between the different groups (Fig. 7). Some images needed to be cropped for analysis, so in order to normalize the number of fibers between each image I divided by the image area to yield fiber density per square μm (Fig. 7B). In general, hCMEC/D3 monocultures appeared to have shorter and fewer fibers than HBVP monocultures and co-cultures. This is unsurprising, given what could be observed by eye in the fluorescence images. What is more interesting is that fiber length and density tended to be very similar between HBVP monocultures and co-cultures. If HBVP collagen IV production remains constant under both culture conditions, this may indicate that HBVPs are responsible for all or nearly all of the collagen IV observable in the co-culture devices.
Collagen IV in μSiM co-cultures may be degraded by MMP-9
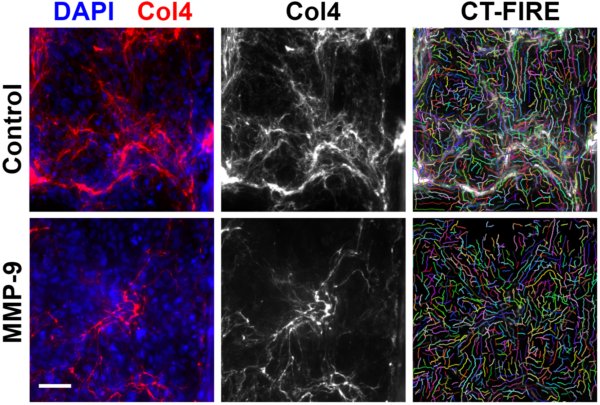
In addition to collagen IV detection in the μSiMs, I am interested in whether or not we can measure collagen IV degradation through fluorescence microscopy. 6 days after seeding hCMEC/D3s in co-culture with HBVPs, the devices were subjected to 0.1 μg/mL active human recombinant MMP-9 (Sigma-Aldrich cat. no. PF140) mixed in media. An equivalent volume of PBS was mixed with media for control cultures. The devices were fixed and stained for collagen IV after incubating for 6.25 hr with either the MMP-9 or control solution. Fluorescence images were taken, and fiber extraction was once again performed with CT-FIRE (Fig. 8).
Examining the fiber lengths and densities provided by CT-FIRE did not indicate a substantial difference between the MMP-9 treated devices and the control devices (Fig. 9).

While it is a convenient tool, I do not completely trust CT-FIRE’s results. I sometimes feel as though CT-FIRE identifies fibers that may not be present; comparing between the bottom right image of figure 8 and its left-hand neighbor should help demonstrate the source of my concern. As such, I decided to try one more simple method to compare between the control devices and the MMP-9 devices. After using Fiji (Available: https://imagej.net/Fiji) to automatically adjust the collagen IV brightness and contrast, the images were binarized (Fig. 10A). I was then able to divide the number of pixels associated with fibers by the total number of pixels to yield a rough estimate of the percentage of total fiber coverage (Fig. 10D). Mean fiber coverage did appear to be a little lower for the MMP-9 condition compared to the control. It is worth noting that 2 out of 3 of the MMP-9 treatment devices suffered broken membranes during the staining protocol (Fig. 10B). This necessitated manual selection of regions of interest for analysis so as to avoid including blurred regions or broken sections of the membrane (Fig. 10C). The manual creation of these regions of interest may introduce some inherent bias. For that reason, I repeated the calculation for percentage of total fiber coverage while omitting all images taken from broken membranes (Fig. 10E). This reduced the data for the MMP-9 condition down to 3 images from 1 device. The mean percentage of fiber coverage dropped noticeably for the MMP-9 condition in this latter analysis.

Conclusions
Pre-coating the underside of the membrane chips with poly-L-lysine prior to device assembly is an effective way to improve HBVP seeding. The cells appear to adhere almost exclusively to the underside of the membrane, mimicking their physiological orientation relative to their endothelial neighbors.
Collagen IV is likely deposited between the HBVPs and hCMEC/D3s in μSiM co-cultures. Successful labeling of the two cell types with specific fluorescent markers that could be resolved in independent channels would help provide more evidence in support of this finding. An earlier primary concern was whether the collagen IV was deposited on the basal side of the endothelial cells. So far, nearly all of the collagen IV deposition that I have observed in the μSiM appears to be produced by the HBVPs rather than the hCMEC/D3s. While the collagen IV is on the correct side of the hCMEC/D3s, it is unknown how its possible presence on the opposite side of the membrane effects endothelial adhesion and claudin-5 expression. It is also not known what factor(s) might induce hCMEC/D3s to upregulate collagen IV. Based on monoculture experiments in multiwell plates, it seems likely that the cells may need longer culture times or different substrates to induce collagen IV production. Rather than coating the top well of the μSiM with a collagen I + fibronectin solution, I may attempt coating with matrigel or other materials.
It is still unclear whether MMP-9 treatment degraded collagen IV fibers in μSiM co-cultures. I examined this possibility using two approaches that appeared to contradict each other. One of the biggest limitations lies in the fact that two-thirds of my experimental treatment group were damaged during staining. I will have more confidence in the results if I am able to repeat the experiment with more intact replicates. The MMP-9 itself should be active, as I tested it using a fluorescence-based gelatin assay kit gifted by the McGrath Lab before beginning the experiment in the μSiMs. Dr. Engelhardt has previously pointed out that MMP-9 may be more effective at digesting pre-degraded collagen IV rather than completely intact collagen IV proteins, so I may need to develop an assay to investigate this.
Postscript: Details about the gelatin assay
In my last round of experiments with MMP-9 at the end of the fall 2020 semester, I was concerned whether the enzyme was inactive or if my working solution may have been overly diluted. Before proceeding with the degradation experiments discussed above, I wanted to test the MMP-9’s effectiveness. The McGrath Lab supplied us with dye-quenched gelatin conjugated to fluorescein (Invitrogen cat. no. D12054). This can be used to assess gelatinase and collagenase activity since the quenching agent is removed when the gelatin components are cleaved, and the increase in fluorescence can be determined with a plate reader. I followed the protocols available here, including the directions for preparing the gelatin stock solution and mixing the reaction buffer. I did not have a standard ladder for comparison, but this was not a concern since my goal was not to determine the specific level of enzymatic activity. Rather, I simply wanted to see if the enzyme demonstrated any level of activity at all. In addition to testing the MMP-9 that was already in our possession (Sigma-Aldrich cat. no. PF140-5UG), I also tested a vial of MMP-9 that was gifted to us by the McGrath Lab (Thermo Fisher cat. no. RP-75653) along with the dye-quenched gelatin. Both enzymes were serially diluted and then incubated with the gelatin (~67 μg/ml) and reaction buffer in duplicate. Fluorescence was read ~3.5 hr after the beginning of the reaction and again at ~26 hr. Note that the excitation/emission maxima listed in the gelatin assay protocol (495/515 nm) were too close together to be read properly by our plate reader, so measurements were obtained by shifting to 485/525 nm. Results are presented in table 1; any unlisted MMP-9 concentrations expressed the same mean level of fluorescence as the control wells without added MMP-9.
| MMP-9 | Concentration (μg/ml) | Mean fluorescence at 3.5 hr (AU) | Mean fluorescence at 26 hr (AU) |
| Sigma-Aldrich | 0.5 | 3.45e7 | 4.0e7 |
| Sigma-Aldrich | 0.05 | 1.8e7 | 1.4e7 |
| Thermo Fisher | 2 | 1.95e7 | 1.2e7 |
| Control (no MMP-9) | N/A | 1.7e7 | 1.2e7 |
| Control (no gelatin) | N/A | 5.4e4 | 4.4e4 |
Table 1. Mean fluorescence of dye-quenched gelatin after reaction with MMP-9. Additional concentrations of MMP-9 were tested, but generated the same mean fluorescence as the gelatin wells without MMP-9. Comparison between the different control wells revealed that the dye-quenched gelatin still gave off substantial background fluorescence even without enzymatic digestion.
Activity was measured in the MMP-9 from Sigma-Aldrich at the two highest tested concentrations. Activity could be measured in the MMP-9 from Thermo Fisher at the highest tested concentration after 3.5 hr, but could no longer be distinguished from the control wells after one day. Looking at the product site for the Thermo Fisher MMP-9, it was unclear to me whether or not the enzyme was supplied in its active form or in its inactive pro-MMP-9 form. Note that it is possible that both MMP-9s were active at lower concentrations, but there may have been too much background noise from the dye-quenched gelatin to measure their activity. Repeating the assay with lower concentrations of dye-quenched gelatin might help to confirm this possibility. Based on the results, I proceeded to experiment with the Sigma-Aldrich MMP-9 at a concentration of 0.1 μg/ml which fell within the range that had successfully demonstrated activity. Note however that the concentration of collagen IV in the μSiM experiments is currently unknown and thus cannot be compared directly to the tested concentrations of dye-quenched gelatin. Therefore, it is difficult to conclude whether or not 0.1 μg/ml MMP-9 is actually an appropriate concentration to yield measurable effects in our BBB model.
References
[1] X. Cong and W. Kong, “Endothelial tight junctions and their regulatory signaling pathways in vascular homeostasis and disease,” Cellular Signalling, vol. 66, p. 109485, 2020/02/01/ 2020.
[2] C. Leclech, C. F. Natale, and A. I. Barakat, “The basement membrane as a structured surface – role in vascular health and disease,” Journal of Cell Science, vol. 133, p. jcs239889, 2020.
[3] T. Osada, et al., “Interendothelial claudin-5 expression depends on cerebral endothelial cell-matrix adhesion by β(1)-integrins,” Journal of cerebral blood flow and metabolism : official journal of the International Society of Cerebral Blood Flow and Metabolism, vol. 31, pp. 1972-1985, 2011/10// 2011.
[4] G. A. Rosenberg, E. Y. Estrada, J. E. Dencoff, and W. G. Stetler-Stevenson, “Tumor necrosis factor-α-induced gelatinase B causes delayed opening of the blood-brain barrier: an expanded therapeutic window,” Brain Research, vol. 703, pp. 151-155, 1995/12/12/ 1995.
[5] J. S. Bredfeldt, et al., “Computational segmentation of collagen fibers from second-harmonic generation images of breast cancer,” Journal of biomedical optics, vol. 19, pp. 16007-16007, 2014.
The quickest way to address the time issue for hCMEC/D3 collagen synthesis is to check the tissue culture plates at shorter times – rather than culturing them in the µSiM for longer times.
That is a good plan. I will be thawing an hCMEC/D3 vial in the near future in order to expand the cells and refreeze. I can establish several tissue culture plates early on and fix one every ~3 days or so in order to check collagen IV deposition.