Flow Cell/µSiM Testing – Push versus Pull Flow Modes
Introduction
Static endothelial cell cultures have been routinely performed and optimized on the µSiM platform for multiple membrane and cell types. In order to increase the physiological relevance of our device with tissue vasculature mimetics, we need to incorporate fluid flow to emulate shear stresses experienced by endothelium under physiological circulatory conditions.
Recently Mehran has delivered flow cell components to our lab in University of Rochester and we’ve been working with both the “Blood Brain Barrier” (BBB) and “Human Tendon on a Chip” (hToC) design variants. Mehran has posted extensively on mechanical aspects of the flow cell, which can be viewed here. Our goal is to ensure that the flow cell operates in our lab under both push and pull flow conditions. For this phase of testing, the key metric is endothelial monolayer stability for short term experiments with no shear priming beforehand.
Methods
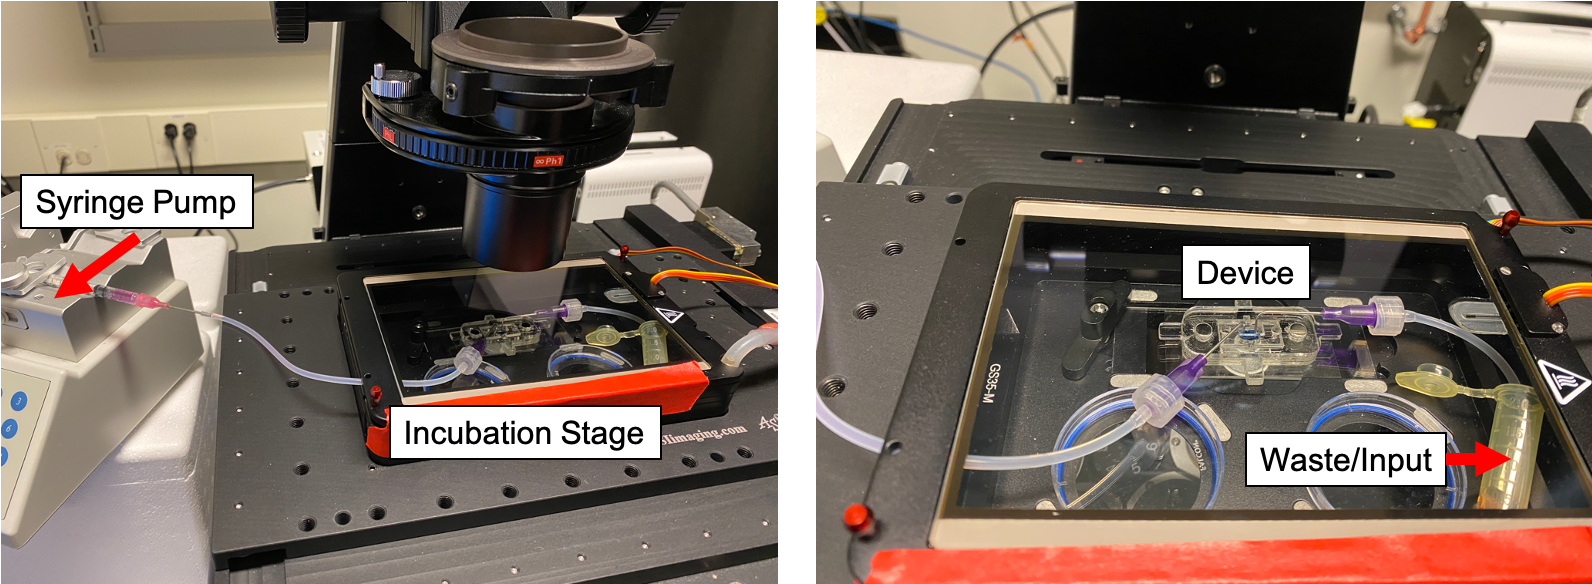
Before assessing flow with cells, control µSiM devices were created with nanoporous nitride membranes (NPN). These devices were subjected to both pull and push flow modes at 10 µL/min using 1x phosphate buffered saline (PBS) for at least one hour. Both the reservoir and 1mL syringe affixed to the syringe pump for push/pull studies were kept at device height. Pressure sensors monitored the pressure differential across the top channel of the device which was later plotted and the flow cell was continuously monitored during experiments for any potential leaks.
The flow setup utilizes an incubation stage attached to a Nikon epifluorescent microscope, allowing for real time monitoring of the endothelial cell monolayer in phase contrast (Figure 1). For this study, human umbilical vein endothelial cells (HUVECs) were seeded at a density of 60,000 cells/cm^2 onto µSiM devices containing NPN. The devices were cleaned 3 hours post seeding by exchanging media in the top well. Then, the devices were incubated for either 24 hours or 48 hours post seeding before push flow experiments began, and 48 hours for pull experiments.
For push flow, two groups of experiments were performed where incubation time post seeding was modified. One triplicate of devices was incubated post seeding for 24 hours before flow, while another group was incubated for 48 hours. For the 24hr group, images of µSiM devices 2 and 3 were taken before incorporation into a flow cell using a 20x LWD lens while the 48hr group had “pre-flow” images taken for all 3 devices via 20x LWD. A syringe pump (Fusion 200, Chemyx) was loaded with a 1 mL plastic syringe containing 1 mL of warm cell culture media (MCDB-131 Complete, VEC Technologies). Tubing was attached to the syringe pump and was subsequently preloaded with media, ensuring no air gaps would be present inside of a device during flow. A seeded µSiM device was then prepared by draining media from the top well, placing a PDMS top channel insert in, and secured with a magnetic clamp. The PDMS top channel was gently prefilled with warm media via P20 pipetter. A small pipette tip was used in order to prevent membrane rupture during the prefilling step. The flow cell was then placed in the stage, all tubing attached, and the stage sealed with lab tape. Push flow experiments were performed at 10 µL/min for thirty minutes for both groups. All recordings were done with a 20x LWD lens in phase contrast, at a frame rate of 1 frame/15 seconds. The first 24hr device was allowed to run for an additional 2 hours to assess system longevity and stability in a non traditional incubator environment. To mimic leukocyte flow into the device and observe flow patterns, 10^5 10.4 µm beads (Fluorescent Polystyrene Particles, Spherotech) were incorporated into 1 mL of media and flown into the first 24hr device at 10 µL/min after 2 hours of non-bead flow. Video was recorded for 10 minutes at 1 frame/second using a 20x LWD lens via phase contrast.
Pull experiments used the same setup as push experiments (Figure 1) and images of the devices were taken before incorporation into flow cells. The syringe pump was instead set to withdraw fluid at 10 µL/min. The tubing going to the 2mL conical was preloaded with media using a P1000 and clamped near the syringe hub to prevent flow until experiment start. The 2 mL conical present in the incubation stage was prefilled with 1 mL of media and placed in the stage such that the bottom was at a downwards facing angle and tubing fed directly to the bottom. Device preparation and video recording parameters were the same as the push experiments (there was no bead flow for the pull studies) and pull devices were only run for 30 minutes each. Note, device 3 had a video recorded using 30x magnification (20x + 1.5x) due to the presence of a large bubble that obscured most of the membrane.
Results/Discussion
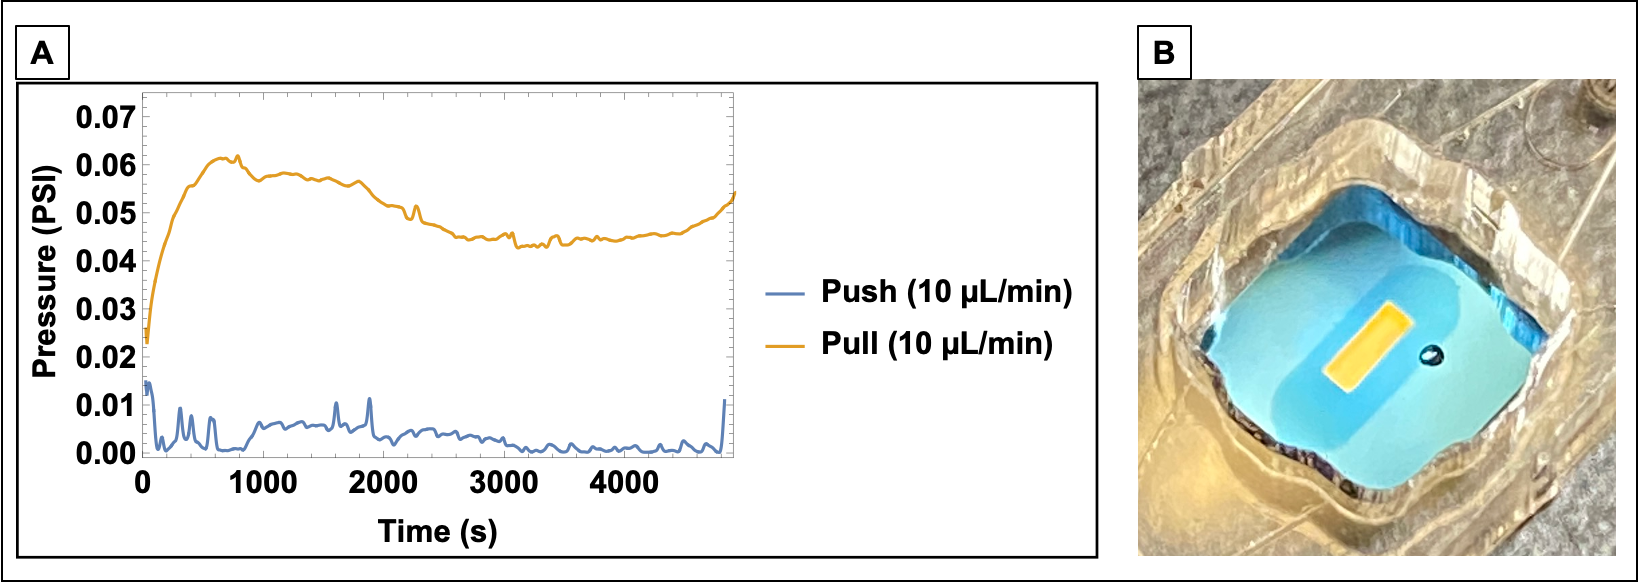
The initial PBS control studies with pressure monitoring display low values for top channel pressure differential between the inlet and outlet for both flow regimes (Figure 2A). While pull experiments display higher pressures, the pressure delta is minimal and unlikely to cause issues with EC monolayer stability. Notably, the devices seal well and have no leaks (Figure 2B).
The push experiments were performed in triplicate and videos can be accessed from the list below:
24hr Group:
Device 1, 24hr Incubation, Push Flow, 30 Minutes
–Device 1, 24hr Incubation, Push Flow, 2 Hours Later
Device 2, 24hr Incubation, Push Flow, 30 Minutes
Device 3, 24hr Incubation, Push Flow, 30 Minutes
48hr Group:
Device 1 Push 48hr Incubation, Push Flow, 30 Minutes
Device 2 Push 48hr Incubation, Push Flow, 30 Minutes
Device 3 Push 48hr Incubation, Push Flow, 30 Minutes
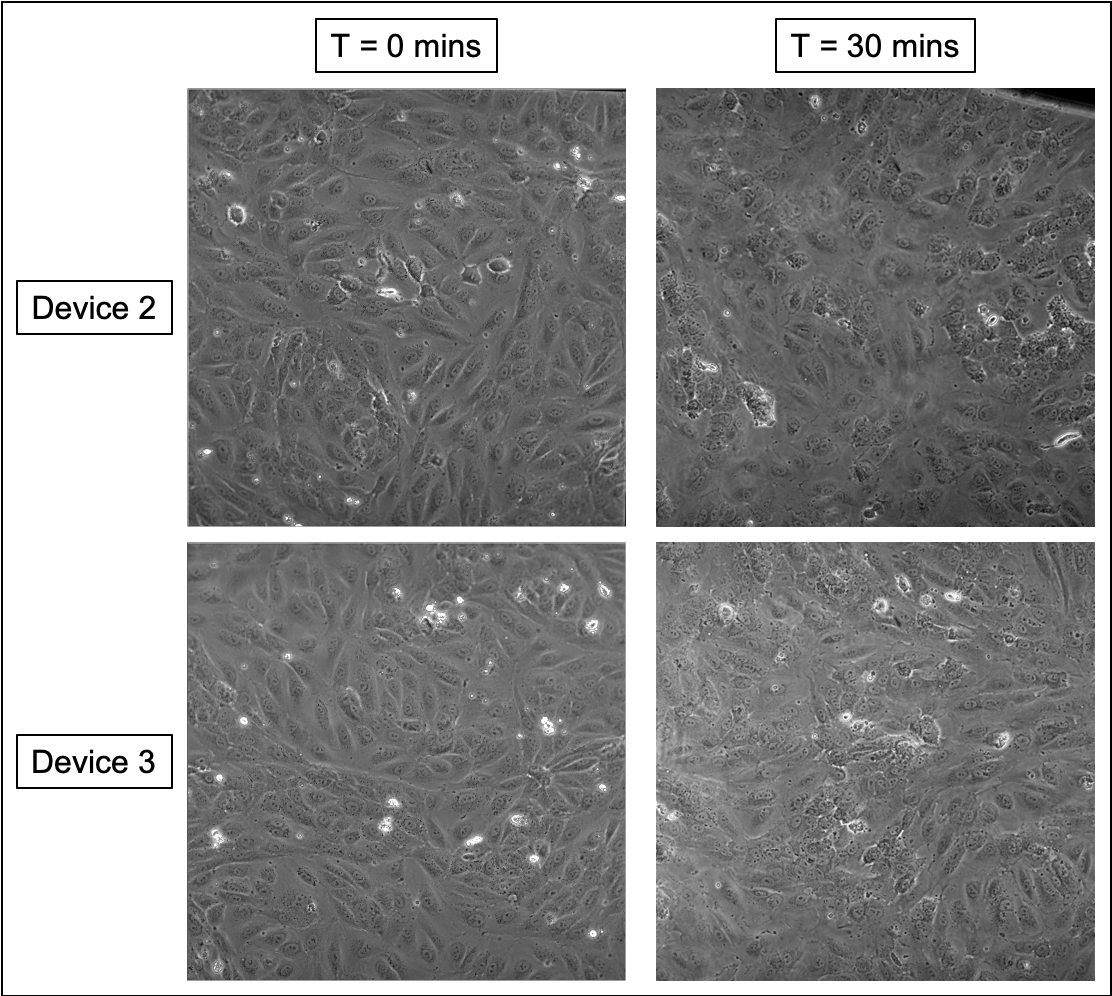
Initially in the 24hr group, EC integrity loss is evident in devices 1 and 2 given the patchy nature of the monolayer and the presence of rounded, apoptotic cells. 24hr device 1 slowly recovers, and by the two hour mark appears to be mostly intact. 24hr device 2 recovers faster than 24hr device 1, and 24hr device 3 had minimal to no EC integrity loss in push flow. In 24hr devices 2 and 3, the HUVECs appear to be less defined after 30 minutes of flow at 10 µL/min (Figure 3). Given that each flow experiment occurred successively, along with lessening EC integrity loss, it may be possible that a cold device/tubing was compromising EC integrity in the beginning, but became less of a factor as the flow components heated up in the incubation stage.
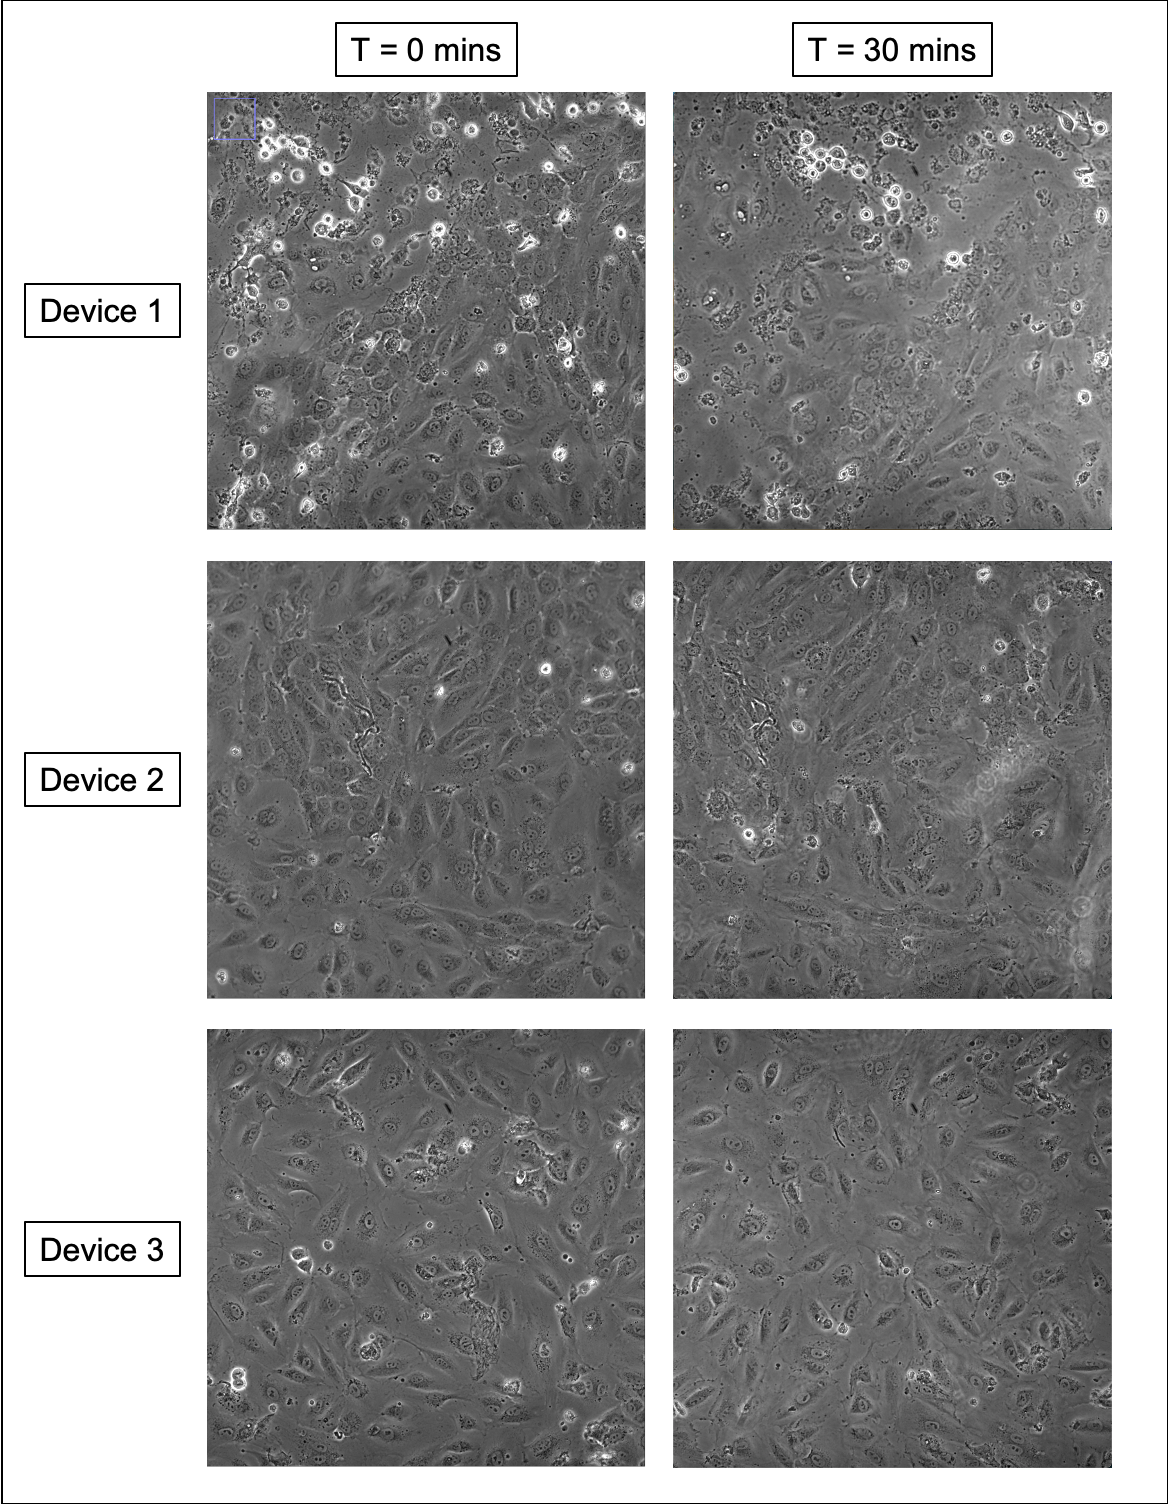
The 48hr incubation group presented more robust initial results than the 24hr group, with the exception of device 1. All three devices had no evident EC monolayer integrity loss during flow, although device 1 had some issues with the monolayer beforehand (Figure 4).
With these results in mind, 48hrs was selected as the incubation time for the pull flow experiments as this group appears to have minimized initial EC monolayer loss upon incorporation into a flow device, unlike the 24hr group.
Device 1 (24hr group) had beads flown in it (after two hours of non bead flow) for a total of ten minutes. The video is posted below in two parts (both roughly 5 minutes each):
24hr Device 1 Push Flow, Beads Part 1
24hr Device 2 Push Flow, Beads Part 2
Beads are seen flowing with even dispersion, until about 8 minutes into the experiment where we see almost no bead flow despite there being plenty of media left in the input syringe. This indicates that the beads are likely settling onto the bottom of the syringe, which is an issue that is unlikely to be seen in a pull setup.
The pull experiments were also performed in triplicate and videos can be accessed from the following list:
Device 1, 48hr Incubation, Pull Flow, 30 Minutes
Device 2, 48hr Incubation, Pull Flow, 30 Minutes
Device 3, 48hr Incubation, Pull Flow, 30x, 30 Minutes
Compared to the 24hr push flow experiments, EC monolayer integrity in pull flow appears to be better, however in device 1 and 3 small air vacuoles appear around the HUVECs. These preceded a larger bubble that cleared out the vacuoles and disrupted EC monolayer integrity, indicating that this issue may be a result of air leaking into the system. Device 2 did not display this behavior. Comparisons of devices 1, 2, and 3 pre and post flow show similar features to push flow, in that the cobblestone morphology pre flow appears to be more muted post flow (Figure 5).

Conclusion
Both flow modes appear to present healthy monolayers after thirty minutes of flow at 10 µL/min. Push results appear to be more robust than pull, noting that the pull devices had a tendency to pull air into the system and were overall more difficult to set up and use. Conversely, push flow experiences particle settling in the syringe which should not occur in a pull setup. This may limit our ability to utilize a push based flow for neutrophil introduction, unless if we change the orientation our syringe pump is placed at by ninety degrees. Ultimately the next set of experiments involving these devices will use neutrophils and measure activation due to flow mechanics.
Acknowledgements
Research Presented in this Post: Danial Ahmad
Flow Cell Design/Conceptualization: Mehran Mansouri