SEM images of exosome scale experiments (After Releasing)
Hello Everyone,
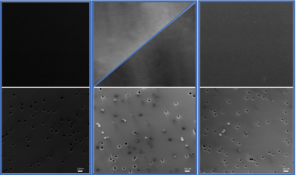
Following of making figures for our first exosome paper, I needed to have SEM images after releasing step. So i ran another experiment and checked the membrane after releasing step. You can see the SEM images of this step:

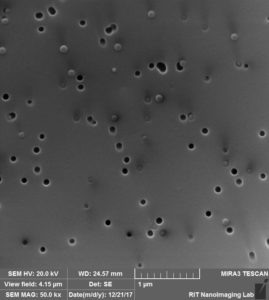


As you’ve probably noticed, compared to after capturing step, you see less captured beads on and in the pores. Therefore, based on the fluorescent intensity analysis and SEM images we can conclude that part of the captured beads inside the pores and most of the beads captured on the pores can be released.
I am still working on the figures and trying to make different versions of each figure but here is how it would look like as one of the options: