SepCon Capture of Exosomes Purified from T24 Cells
Over the course of this past year and 3 months, I have been on a long and perilous quest to reproduce data that I obtained during my rotation in the McGrath Lab. Specifically, I was looking to capture exosomes in the pores of our membranes, as I showed in my post here (See the last figure in the post). However, over the course of this past year, I have fought dragons, braved icy mountains, sailed the treacherous oceans, and assailed many castles to again come across these results. However, it seems that I may have finally come across the damsel that is my data and I have saved her (it).
There are two factors that are coming in to play in the recent work that I have been doing to try and repeat the exosome experiments that I had such good results from last year. One of these factors is the purity of the sample. Obviously, we are after isolating these from complex fluids and I have seemingly shown that we can isolate them from plasma, but the simplest system for actually confirming that we have exosomes in our pores are pure exosomes. These are particles that we can confirm are exosomes, that people know (or believe) to be exosomes and are the only thing present in these samples. This would leave us without a doubt of what the sample is on the membrane. So, for a while, I tried isolating exosomes from our plasma using ultracentrifugation. However, this did not go the way I wanted it to. This led us to looking for people who work with exosomes, to see if they had pointers and if they could possibly give us a sample. As I’ve mentioned in a previous post, and as Aslan mentioned, we came across the Beckham Lab in URMC.
Without going into too many more details, they basically gave us some exosomes that came from cultured T24 cells (which is a bladder carcinoma cell line) that were purified in two methods. The first was standard ultracentrifugation, which they let me have a 500 μL sample and then the second was sucrose gradient ultracentrifugation, which was a sample of about 10 μL. The first sample was not characterized, so I don’t know concentrations or size distributions, but the second sample was characterized by Nanosight. This was really helpful because it let me know the sizes of the particles and the relative concentrations. The exosomes were in the concentration range of 4.5 x 10^10 ± 0.5 x 10^10 exosomes/mL. This meant that in the 10 μL sample there was about 10^8 exosomes. As for the size distribution of the exosomes/particles, this data is shown in Figure 1:

Figure 1: Nanosight particle size distribution of the T24 exosome sample. The majority of the particles are approximately 108 nm in size, with two significant fractions at 139 nm and 201 nm.
With this sample, the next goal was then to try and capture these particles in dead end filtration. If nothing else, this would allow for simple capture and isolation for imaging and analysis. Even though these samples are pure and don’t represent our actual desired sample, this is again a very important control, just to confirm what exosomes look like. For these experiments, like my gold isolation experiments, I used the chips from wafer 2226 (50 nm pores, 5 slot membrane) and a centrifuge speed of 2500 rpm. I used the sample of sucrose gradient purified exosomes for these experiments. I resuspended the 10 μL volume into 990 μL of PBS (as that is what they were already suspended in), which I then took 200 uL of this sample and diluted it further with 200 μL of PBS. The volume of this sample that I used in my devices was 200 μL for each device (2 devices). Then I removed the chips from the SepCon and fixed using 2.5% glutaraldehyde. I dried the samples in the critical point dryer and then imaged them. These results are shown in Figure 2:
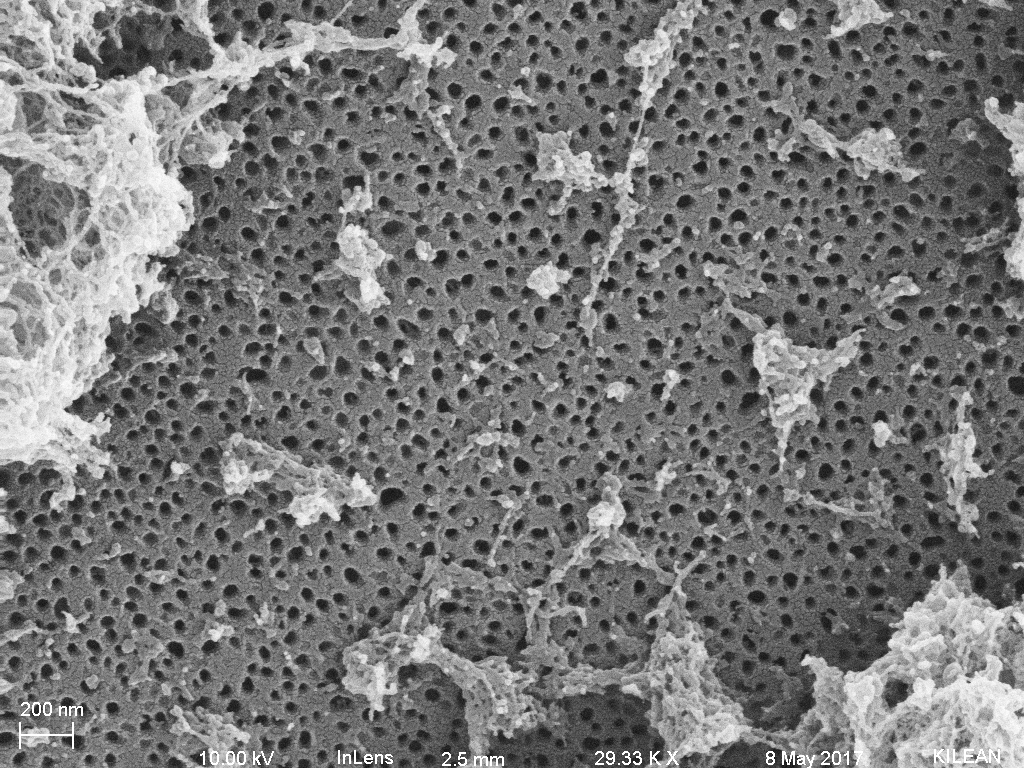
Figure 2: Pure exosome sample fixed and dried. There are particles that appear to be similar in size to exosomes, but there is lots of aggregated junk on the membrane too.
While this resulted in some particles that could resemble exosomes, I wasn’t really satisfied with this data and I took it to Jim. We looked over it and then concluded something that takes me all the way back to the start of this post and the second point that I mentioned.
At some point last year, in trying to preserve the integrity of the membranes upon removing them from the device and during drying, I switched my protocol for SEM prep to fixing the sample with 2.5% glutaraldehyde and then critical point drying it before coating with gold at Jim’s suggestion. This vastly improved the recovery rate of these membranes. However, we started seeing filamentous material on the surface of the membranes. Initially, we concluded that this was old sample and possible cell free DNA contaminants and that perhaps there was something wrong with our samples. In fact, this spurred the movement to try and get these purified exosomes so that we knew what exactly we were dealing with. But rather than being a contaminant, Jim hypothesized that the glutaraldehyde procedure that he suggested using might be affecting our samples. As glutaraldehyde works by crosslinking proteins, it is possible that when I introduce it to the surface, any small amount of protein immediately becomes involved in this process and perhaps would include the exosomes, pulling them from the pores or from the surface. This could result in the filamentous like structures that I was seeing rather then the individual exosomes that I was hoping to see. So I repeated the experiment, expect this time without fixing and critical point drying. This goes back to the original experiments, where I would pull the sample out and let it dry and just coat it. These results are shown in the following figures:

Figure 3: Particles captured on the membrane in dead end filtration

Figure 4: Particles captured on the membrane in dead end filtration

Figure 5: Particles captured on the membrane in dead end filtration.

Figure 6: Particles captured on the membrane in dead end filtration.

Figure 7: Particles captured on the pores in dead end filtration.
I apologize that the figure captions are all the same, but I really don’t want to bias any thoughts that you may have on the results. As we can see, there is salt on the surface of the membrane, which we expect due to the presence of buffer and lack of a washing step. However, the particles are not the geometry of salt crystals. Additionally, we can go back to the data given to us in Fig. 1. This data, from the Nanosight, tells us that the majority of the particles that were measured in this sample were in the range of 108 nm. Using ImageJ, the average size of the particles in these images appears to be 82 nm, which accounting for shrinking during drying, would suggest that these two data sets correlate very well. We can even see some particles residing in pores, like we saw with the data from last January. These data fully suggest that the particles we have captured and are seeing are exosomes, which is a confirmation that our process does indeed work.
Moving forward, I am looking to repeat these experiments with tangential flow and hopefully get the same results. For now, I will refrain from using fixative on these samples, as it does not appear necessary. I will limit the use of my remaining ultra pure sample, perhaps trying these experiments with the slightly less pure samples. But the one thing that I know for certain is that it appears like we are back in business!