(Almost) Final Versions of Model Paper Figures
We’re submitting the following paper to Separations and Purifications within the next two weeks:
Below are the (almost) final versions of the figures from the paper.

Figure 1: Schematic of Particle Distribution for Particles Rejected by Membranes The distribution is a quasi-equilibrium between convection towards the membrane and back diffusion, which is described by Poisson-Boltzmann statistics.
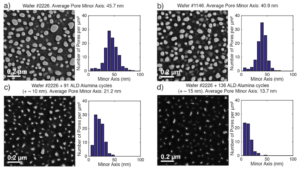
Figure 2: Modification of Pore Size Distributions through Atomic Layer Deposition We used two different NPN wafers (a and b) and two different ALD runs (c and d) to create a spectrum of four different pore size distributions. Note that adding alumina to the membrane shifts its pore size distribution leftward, and also narrows it, due to the hard bound at zero.
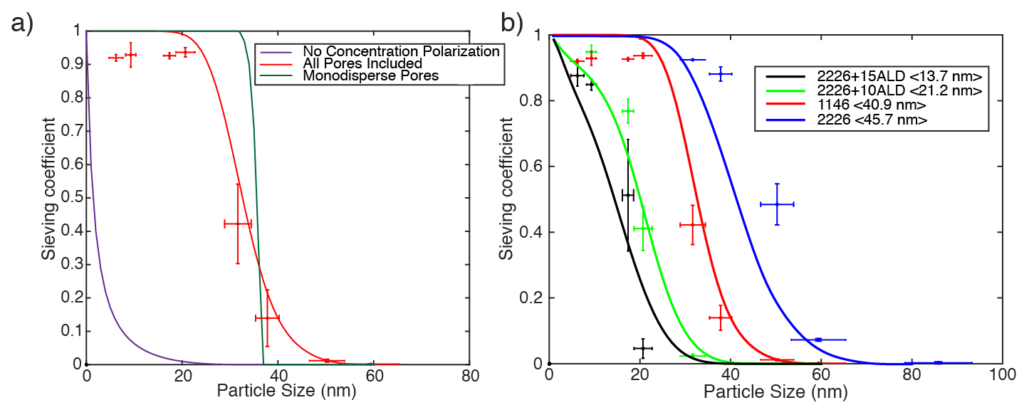
Figure 3: Gold Sieving Model Predictions and Experimental Data a) Using the four membrane populations from Figure 2, we found that our model is predictive of the sharp transitions characteristic of gold nanoparticle separations with NPN membranes across a variety of particle size to pore size ratios. b) A sieving model that fails to account for concentration polarization behind the membrane does a poor job of predicting experimental sieving behavior of gold nanoparticles through an NPN membrane, while modeling NPN as a collection of perfectly uniform pores results in a sieving cutoff sharper than that experimentally seen. A model that includes both concentration polarization and the real pore size distribution fits the data the best of the three models.

Figure 4: The Effect of Membrane Thickness and Pressure on Sieving Curves a) The sieving curves at two different pressures are shown for three different membranes membranes with uniform pores of 40.9 nm and thickness of 10 μm, 60 nm, and 1 nm, corresponding roughly to the thicknesses of TE, NPN, and 2-D graphene or graphene oxide membranes. b) A direct comparison between the sieving behavior of NPN and two different sizes of TE membranes at various pressures. Solid lines represent model calculations using the real distribution of pores. We find that the sieving curves of NPN membranes are weakly (but still significantly) dependent on pressure, and our model is predictive of this.

Figure 5: Mechanistic Studies with Predictive Model a) The benefit of thinner mem- branes is quantified by plotting membrane thickness vs. resolution at two different pressures based on model predictions. b) Model predictions of the sieving behavior of uniform pore distributions at various thicknesses, operated under different pressures to achieve the same flux through the membranes. c) Peclet number for the separations performed in b (solid line) as well as separations with the same membranes at a higher isoflux condition. Note that once the Peclet number of TE rises above one (i.e. the separation is dominated by convection) its performance begins deviating from that of NPN. d) Comparison of the Peclet number for NPN at different pressures. A two order of magnitude change in applied pressure can change a separation from dominated by diffusion at all gold sizes smaller than the pores to one dominated by convection for all gold sizes.
Supplemental Figures:

Figure 1: Pressure is applied to the fluid via a nitrogen tank while the transmembrane pres- sure is monitored through two Ag/AgCl electrodes hooked up to a voltmeter. The NPN or alumina-coated NPN chip is sandwiched between two o-rings. The chamber is machined out of polycarbonate and held in place with an aluminum housing. We based our streaming potential device on Burns et Al.’s device[6]

Figure 2: a) A model that assumes uniformly sized pores captures the experimental observa- tion that the sieving curves get sharper at higher pressures better than the model using the size distribution. We hypothesize that during separations, the normal distribution of pores (b) can be “truncated” by selective plugging of the smallest pores, leading to a sieving curve that shifts and more closely resembles the monodisperse model (c). We have seen that adding a small amount of 100 nm gold NPs to a gold size ladder can cause a shift in the sieving characteristics of a membrane (e) which we believe to be due to a similar gold-size-dependent truncation of the pore size distribution (d), albeit from the opposite direction.

Figure 3: a) The sieving coefficients of gold nanoparticle separations are weakly dependent on the volume passed through the membrane. This is because over time the concentration at the membrane of nanoparticles increase, as shown in b). This results in gold-size-dependent relationship between increased volume passed and sieving coefficient, as shown in c).

Figure 4: When the membranes are compared during higher pressure but still iso-flux separa- tions, the Peclet number of NPN rises above 1 for small particle sizes (dashed line in Figure 2a), meaning NPN and TE performance, both being dominated by convection, are indistin- guishable. Note that in Figure 2a, NPN and TE perfectly overlap. Graphene, with a Peclet number below zero for all sizes of gold nanoparticles modeled, has better performance.