I have tinkered with the etch recipe some more, adding Argon to help prevent polymer formation (adding 5% O2 was not enough). The current recipe is 200 mTorr (100 mTorr Ar, 5 mTorr O2, 95 mTorr CHF3) at 120-125 W (6-12 W reflected). The plasma color is initially rosy (Argon), settling into a light purple after a few seconds (Light blue from CHF3 and O2 mix). After 140 seconds of etch using this recipe, the coated (250C, 1-3 A/s, 50nm) MgF2 films remain, while the backside is fragmented and discontinuous.
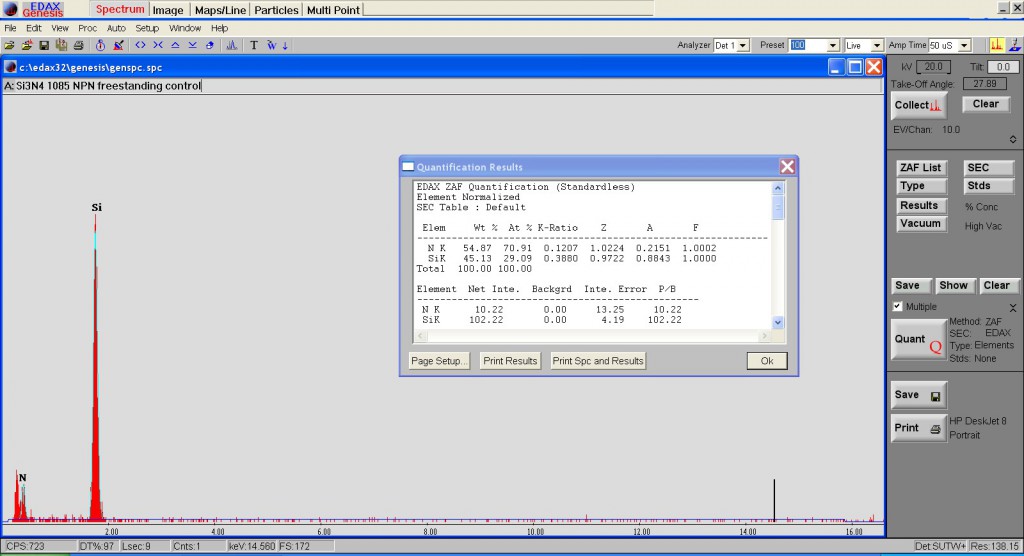
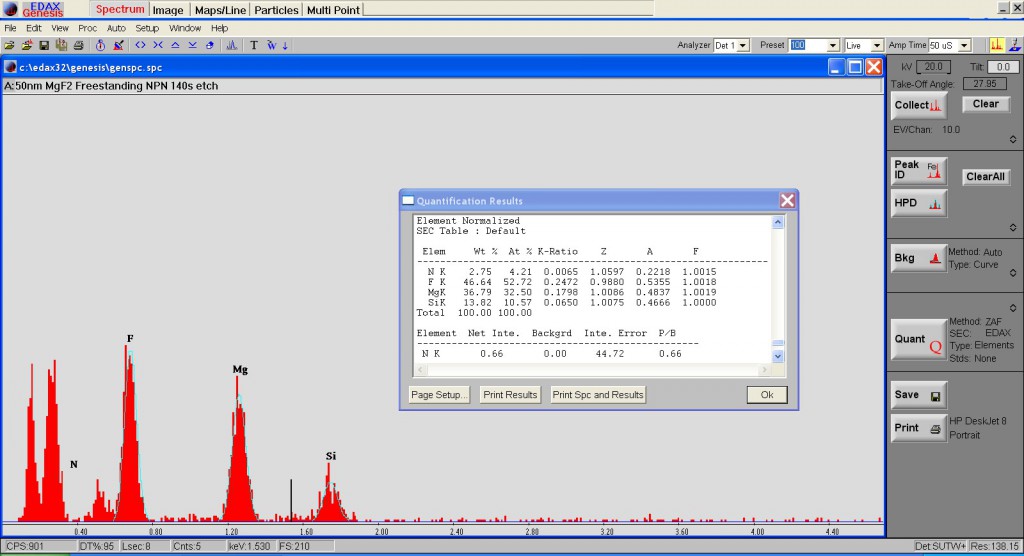
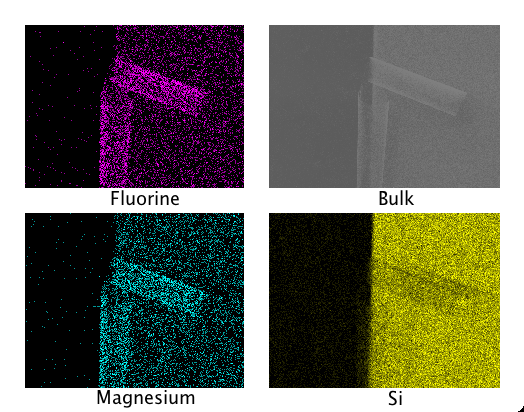
The true composition of these films has yet to be confirmed. Using EDAX on our SEM, I was able to find a decrease in the relative Silicon composition of the etched film, though some signal remains. I hope to get an XPS reading soon to confirm this result.
In the discontinuous film state, the etched free-standing membranes have survived for 48+ hours. The burst pressure for these films (SEPCON format) were 1.5 and 1 psi, much weaker than what we are used to having from nitride alone (thermal processing after deposition to densify the films may help in the future).
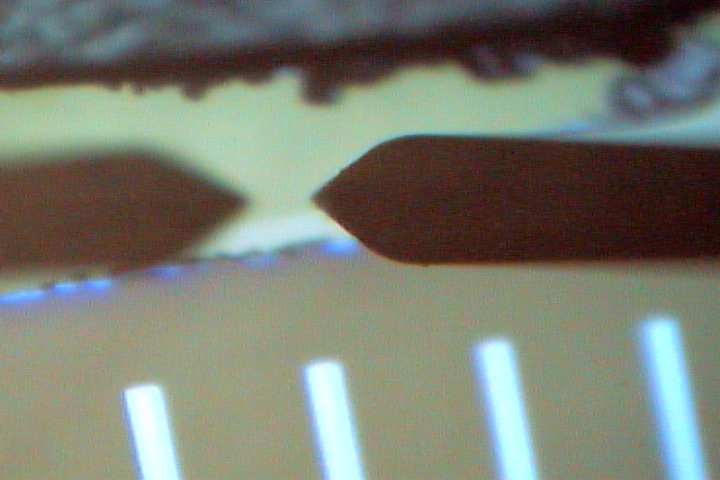
Step height on 50nm MgF2 film (kapton tape occludes deposition surface)
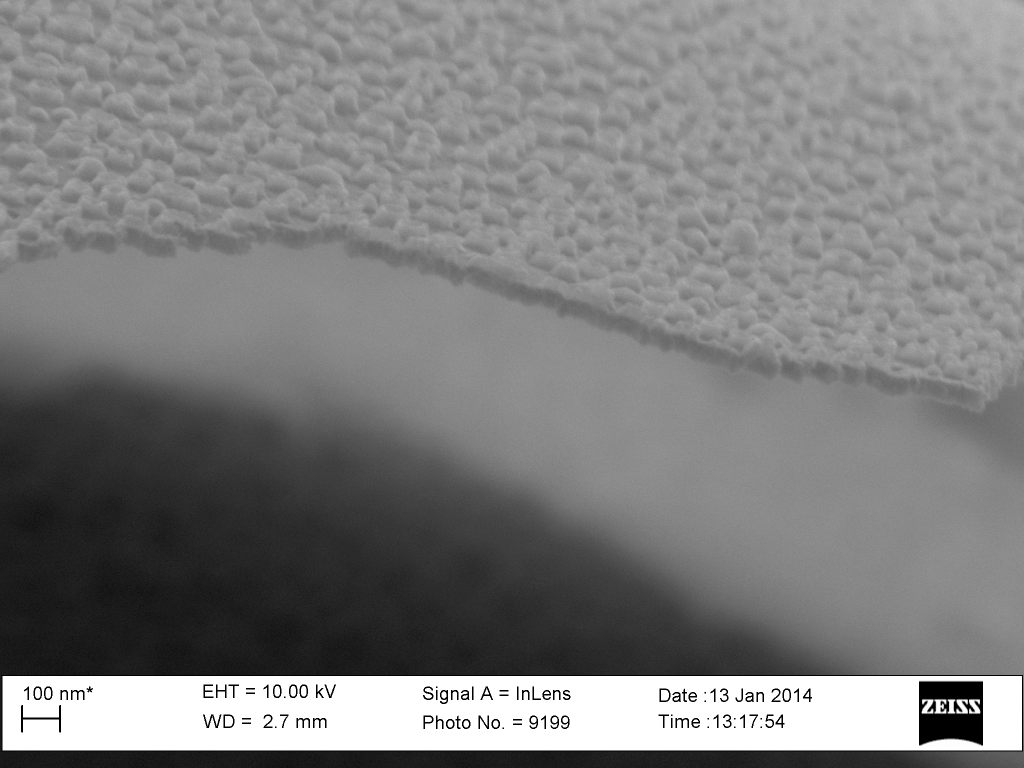
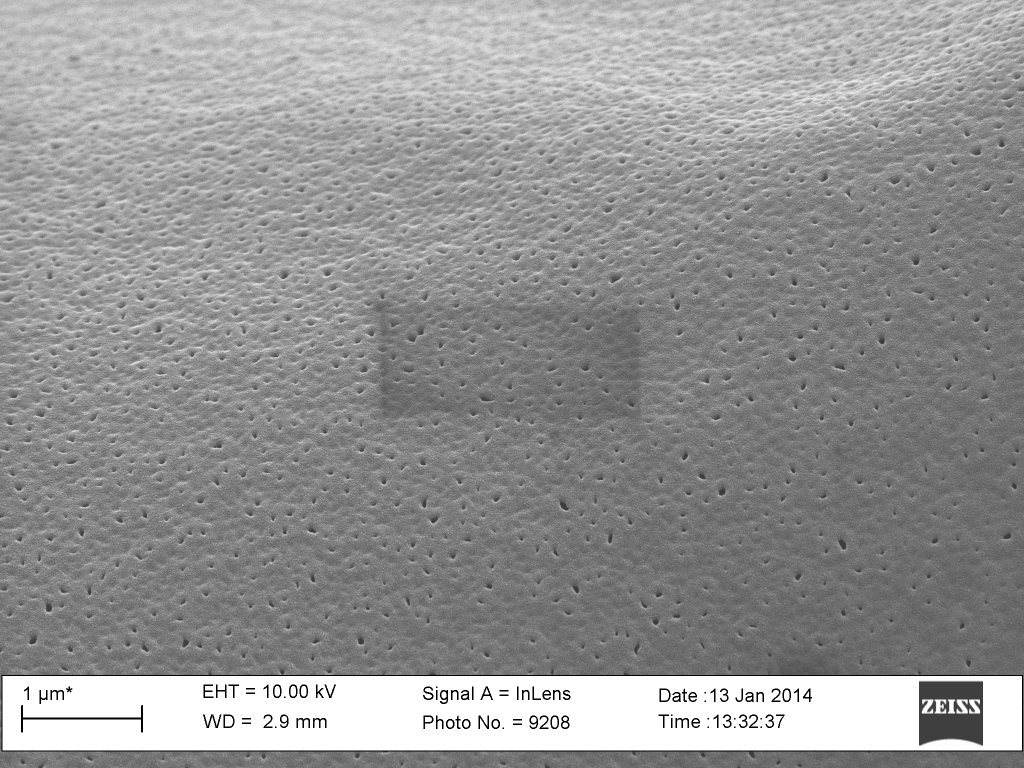
Sample 40, 50nm MgF2, 140s Ar+CHF3+O2 etch, curling up from freestanding region. The dark region is the bulk. The top face would be where the silicon nitride has been etched (backside)Sample 40, 50nm MgF2, 140s Ar+CHF3+O2 etch, curling up from freestanding region. The dark region is the bulk. The top face would be where the silicon nitride has been etched (backside). The film appears discontinuous, with little volcano structures remaining. Ideally, we would have none of these structures remaining with a more complete etch.Is the etched Film Pure MgF2?Or is the remaining film scummed up with Si3N4 volcano structures around the pore?
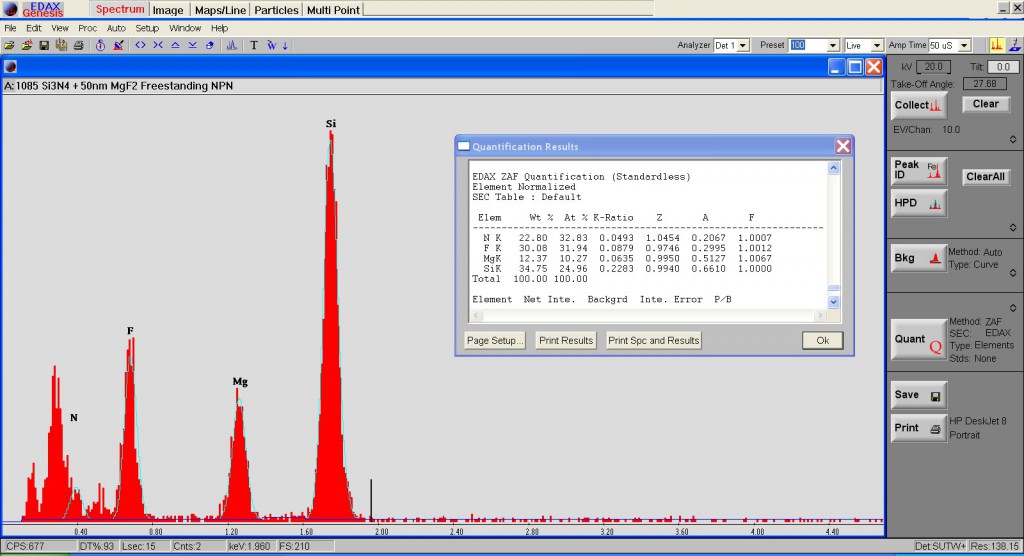
Control 50nm NPN EDAX measurement. Pure Si3N4 is expected.50nm NPN with 50nm of MgF2. This film has not been etched.140s Etched MgF2 membrane. Little silicon remains in the signal (85% MgF2). The larger peaks on the left are the Carbon background.I tried measuring another etched film with a different holder (Al). Again, the silicon signal remains. This sample had 120s etch (compared to 140s).This sample had 180s of etch, but no signal is coming out of the membrane? Clearly a freestanding region under SEM, and a measurement on the sidewalls of the chip confirm the EDAX detector’s functioning.
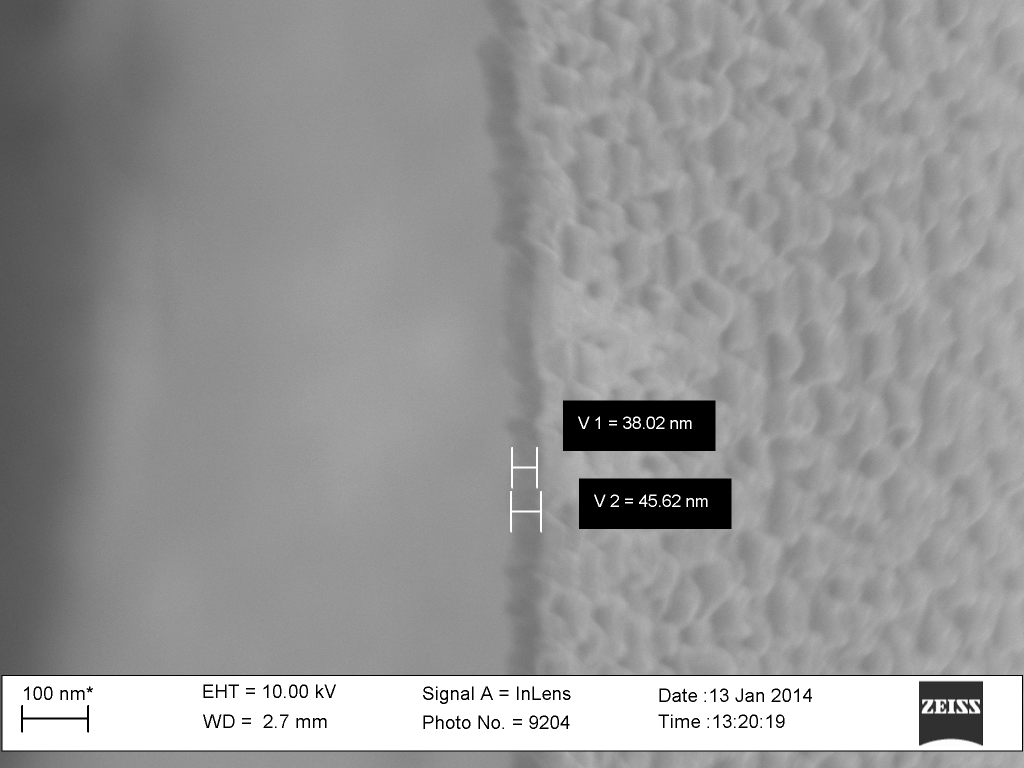
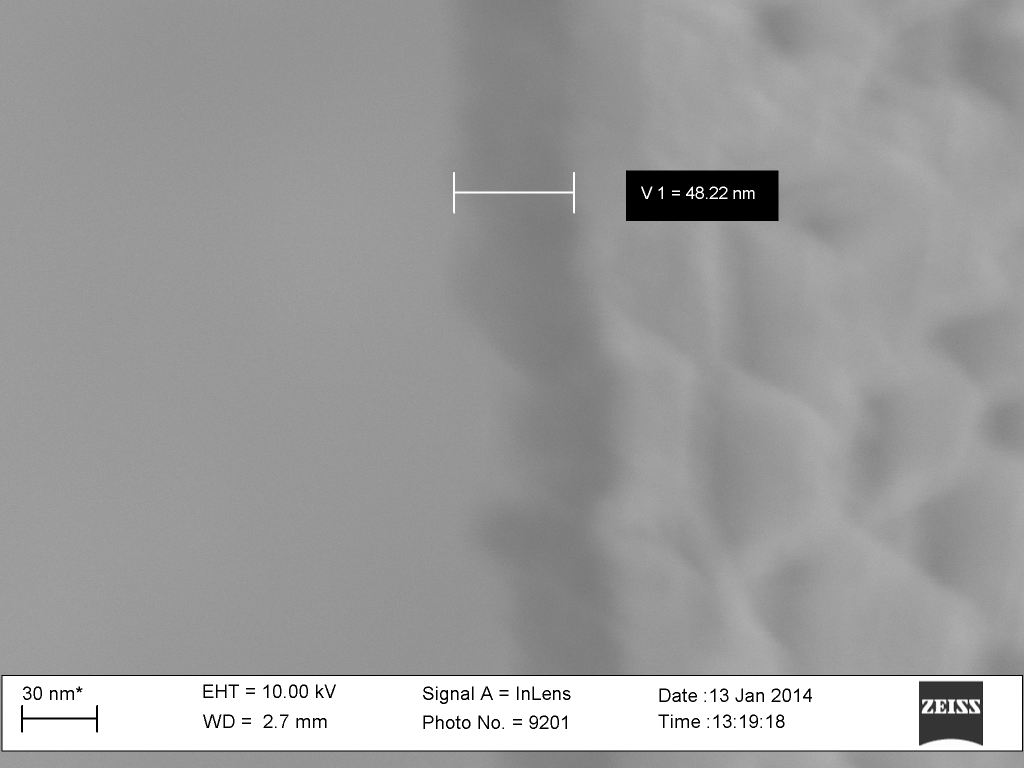
Sample 40, 50nm MgF2, 140s Ar+CHF3+O2 etch, curling up from freestanding region. Film thickness of MgF2 film is preserved.
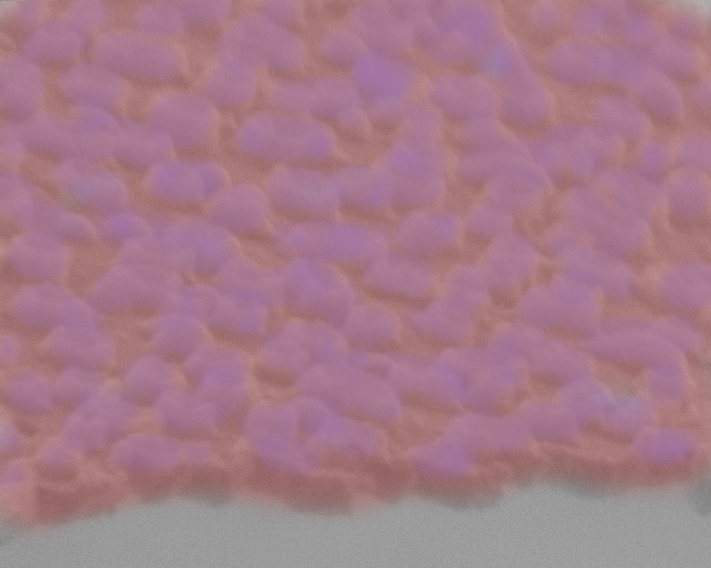
Sample 40, 50nm MgF2, 140s Ar+CHF3+O2 etch, curling up from freestanding region. Crossection shows the thickness of the MgF2 film remains the same.Sample 40, 50nm MgF2, 140s Ar+CHF3+O2 etch, curling down in freestanding region. MgF2 surface appears much smoother, with through pores apparent.
Sample 47, 180s etch SEM mode.Sample 47, 180s etch, TEM mode.
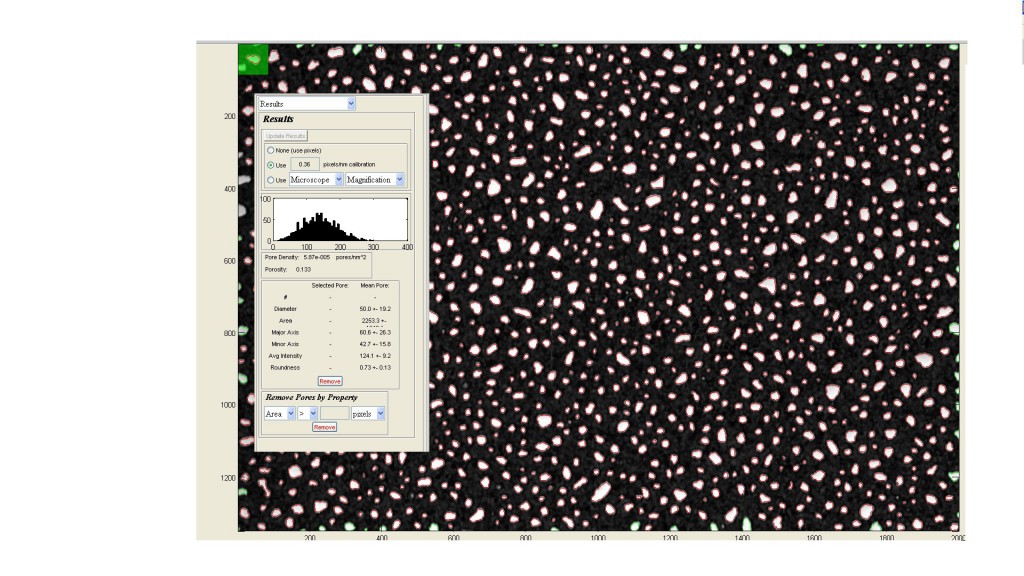
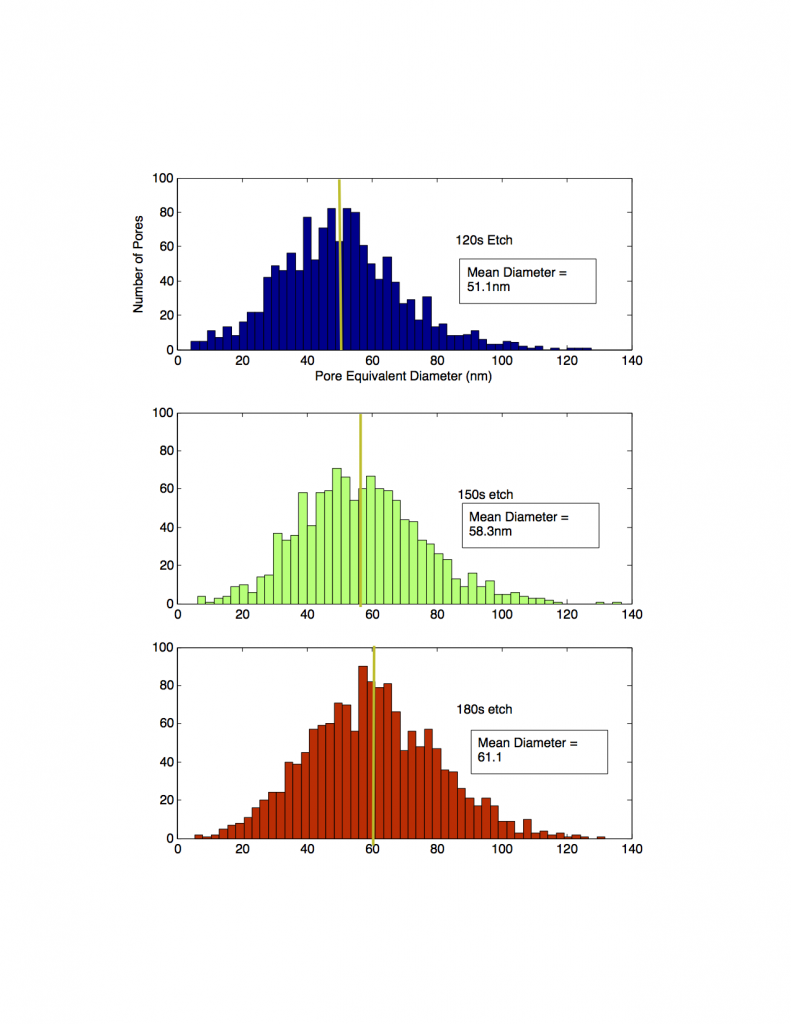
47 – Pore Histogram
Pore Histograms from samples 45, 46, and 47. Sample 45= 150s, 46=120s, 47=180s. Etching longer appears to blow out the pores somewhat, though the resistance is fairly high for 60s of additional etch time.
After correcting a minor error in my code that was giving me some weird limiting behavior, and optimizing the code to give me faster results, I generated the following curves: Note that, as experiment predicts, the ‘sharpness’ of the graph increases with increasing applied pressure. The model isn’t exact, and slightly underestimates the actual sieving…
I am attempting to fabricate a free standing, porous, MgF2 nanomembrane for Raman spectroscopy applications (see my previous post for background). To that end, I’ve used the Lesker p75 evaporator in the basement to deposit ~100nm of MgF2 on one of our nanonitride Sepcon chips (Wafer 1055, 50 nm SiN, 2% porosity, 20-40 nm pores)….
Down the road, we’re going to move towards large-animal studies to test our hemodialyzers, since a large animal model (either a sheep or a pig, preferably the former) allows us to model the effects of complete kidney failure (as opposed to just uremia in rats) and work on a scale that would be comparable to…
While experimental results are still forthcoming, I thought I’d make a post about the nature of the model I’ve constructed for ECMO. This model is the one that my experiments are seeking to validate; so to be clear, this model is founded entirely in theory for now. ECMO shares some obvious similarities with hemodialysis — blood…
(Transferred from old blog) From the above discoloration array it can be inferred that the RTP treated samples in the incubator are discoloring in much slower rate than the ones on the benchtop. Thus, incubator conditions prevent the chips from discoloring. The reason behind this could be the carbon dioxide present in th incubator which…