Fluorescence Through Various Substrates – Statistical Analysis
In a previous post I had shown the relative fluorescence of various substrates as normalized to glass. 1um beads (either green or red) were placed onto each surface and imaged with constant EM Gain, exposure time, and intensity. Bar graphs were constructed to show the relative fluorescence (red and green were not normalized to each other). This graph indicated that SiO2 and glass were fairly similar for red fluorescence, and that SiN was consistently worse in both wavelengths (red and green). Track-Etched (TE) membranes appeared worse than glass and 120nm SiO2 in red, but equivalent to 120nm SiO2 in the green spectrum.
Here is an updated version of the bar graph, including the 300nm SiO2 as well:

This shows a semi-quantitative analysis of fluorescence; however, no statistical significance has been assigned to the values and comparisons.
To add statistical relevance to the plot, I recently performed an ANOVA test and a series of t-tests on both sets of data (red and green). The full results are in the attached excel document.
Overall, it seems to be that in red fluorescence, glass and both types of SiO2 are statistically similar (P > 0.05), and for the most part are superior to other substrates.
In green, however, glass outperforms all other substrates and 120nm SiO2 is similar to TE, while 300nm SiO2 is similar to SiN (P > 0.05).
For both red and green, the ANOVA test yielded a p-value of much less than 0.05, indicating that there were sets within each group which statistically differed from each other.
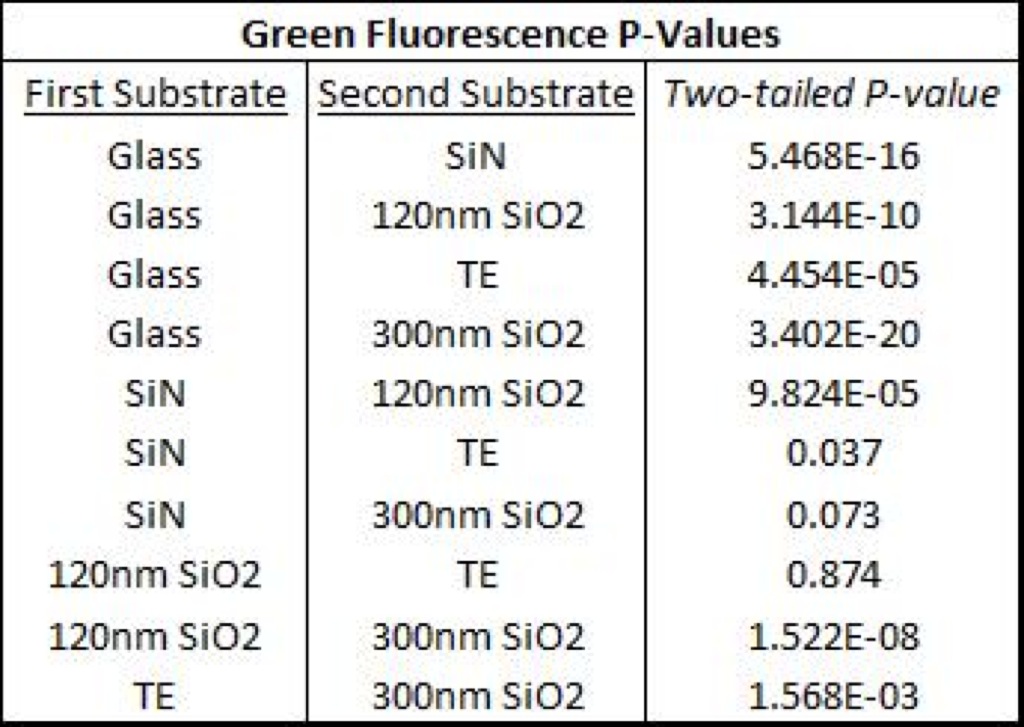
The following tables show the two-tailed p-values for each comparison (first table is for red, second is for green).
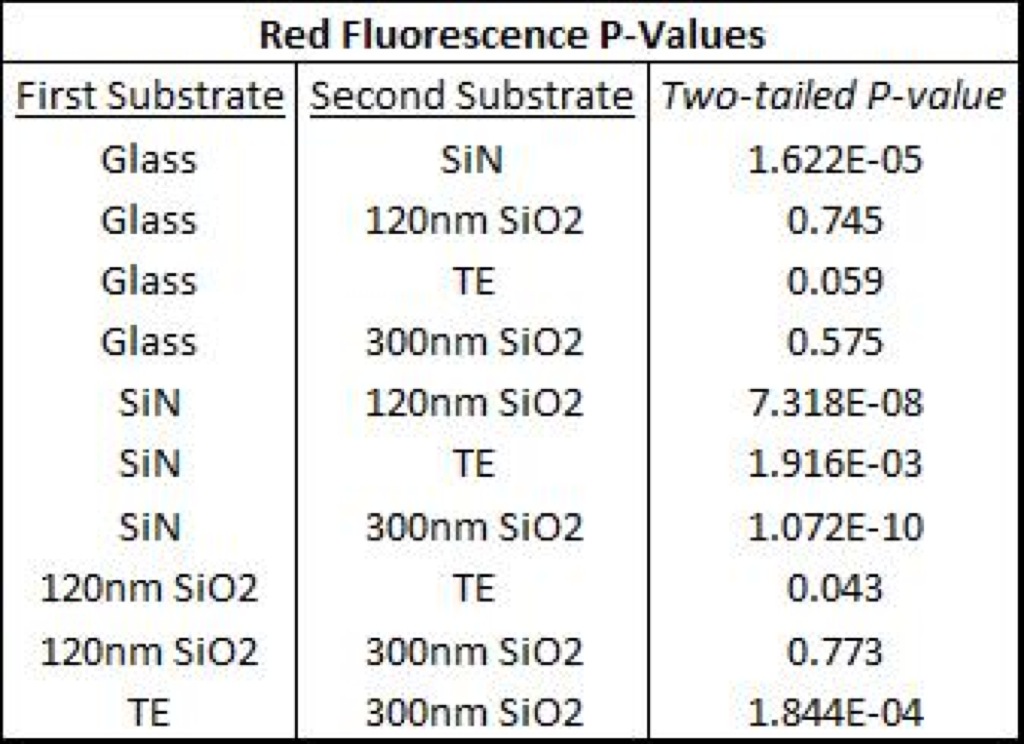
From this data, it seems that in red fluorescence that glass, 120nm SiO2, and 300nm SiO2 are not statistically different from each other (P > 0.05). This also shows that the TE membrane was not different from glass (P > 0.05), though it was different from both SiO2 membranes (P < 0.05).
All other comparisons between substrates under red fluorescence yield statistical difference (P > 0.05).
For green, the data shows that glass is not statistically similar to any other substrate (P < 0.05). However, SiN and 300nm SiO2 seem to be close to each other (P > 0.05). This does seem to follow with the similarity seen between phase contrast images of the thicker SiO2 membranes compared with the SiN membranes.
It does seem that 120nm SiO2 and TE membranes are very similar (P > 0.05). Based on previous data regarding green/blue fluorescence in cells on 120nm SiO2 and TE membranes, the similarity of values does seem to be consistent.
The differences in transmitted fluorescence values in the green channel can’t really be explained by the different materials or different thickness of the membranes. Can you think of any other aspect of the experiment or optical system that could be creating these differences? Are there pores in these materials? If so, are the pores the same size in all cases?
Thanks!
Some of the material was porous (SiN, 300nm SiO2, and TE), while some wasn’t (Glass, 120nm SiO2). However, when performing the analysis, I did make sure to avoid including measuring beads which were over pores in the porous materials.
Also, as Jim commented, I’ll be repeating this with all substrates in CytoVu format. My control (just Glass) was not fully consistent with every other trial (mainly TE), so this repeat will help to remedy that; hopefully green will make more sense then also.
NRG feedback: repeat with all surfaces done in the cytovu format. Attach polymer membranes and glass to backside of membrane chips for a good head-to-head comparison.