Returning to CytoVu Protein Adsorption
In the wake of the apparent loss of all of the phosphatase in a sample that was placed into a CytoVu well, left for 24 hours, and then checked for phosphatase activity, it’s become clear that the adsorptive qualities of the CytoVu assemblies needs further characterization. I showed in an earlier post that there was some loss of Cytochome C that was allowed to diffuse through the membranes of a CytoVu, but never quantified it in terms of a mass or number of moles — only as a change in concentration. That was fine for the high concentrations of protein used there, but since switching over to enzymes the concentrations have dropped several orders of magnitude. This means more work needs to be done.
The basis for the test I’ve set up is the idea that a certain amount of protein will adsorb to the surfaces of the CytoVu before it reaches a sort of saturation point, where no more protein will adsorb from the solution present in the well. In order to test this, I made up a ladder of small concentrations of BSA. For each point of data, I incubated a known concentration of BSA in buffer in a well of the bottom half of a CytoVu (just the bottom gasket and glass coverslip) for an hour, then removed it and added the same concentration of calf intestinal alkaline phosphatase into each well to sit for another hour, before sampling each well and assaying its contents for phosphatase activity. The results:
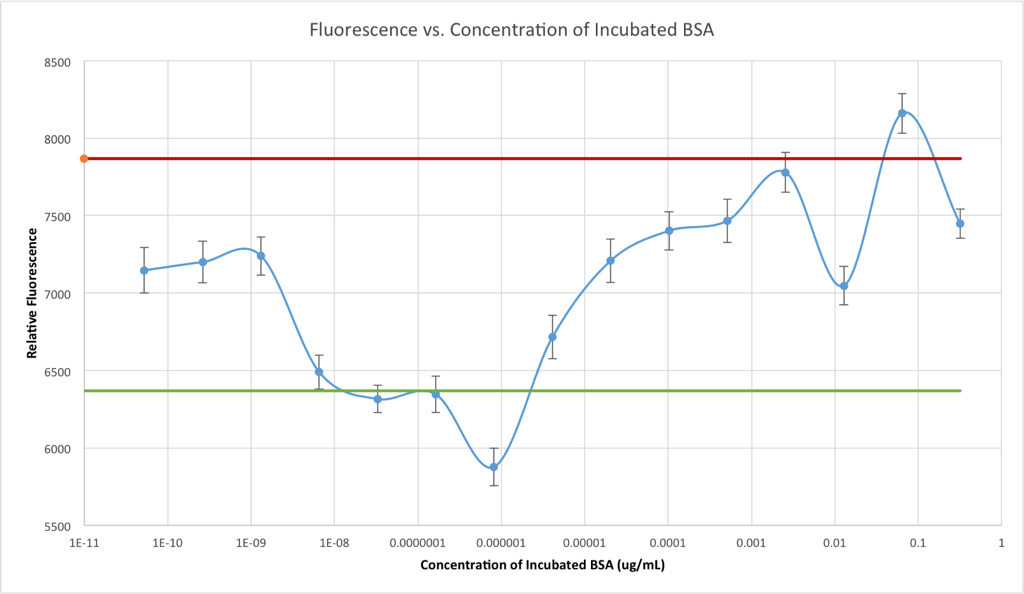
The red line represents the negative control (no adsorption,) which was just the same concentration and volume of phosphatase that had never seen a CytoVu well, and then green line represents the positive control, which was the fluorescence level of phosphatase that had been incubated in a well that had contained pure buffer while the other wells were incubating BSA.
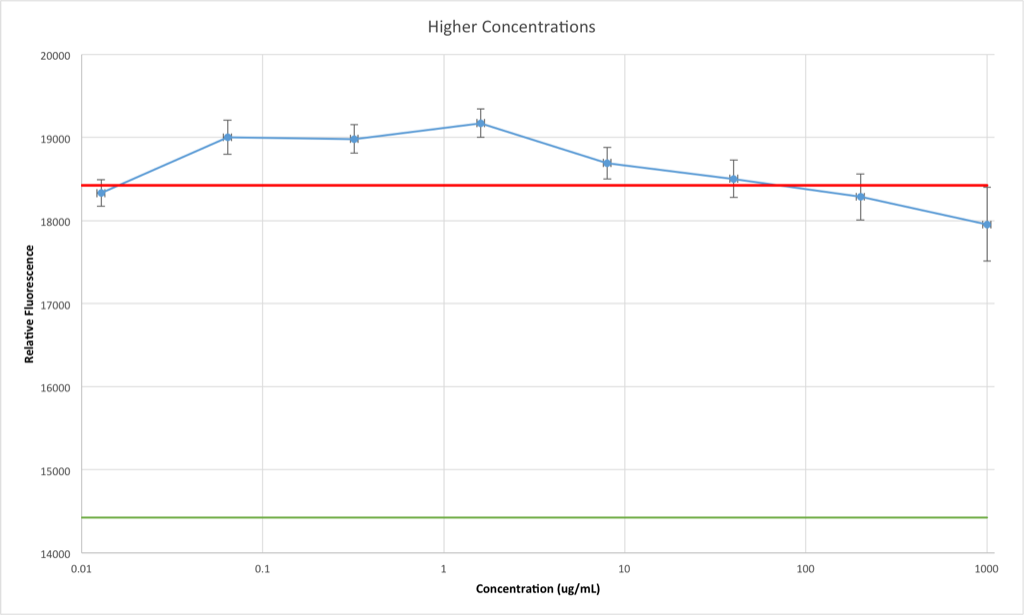
This one is very clear: the incubation of high concentrations of BSA in the well beforehand prevents the adsorption of enzyme to the PDMS and/or glass surfaces. This graph could be appended to the right side of the first graph, but I kept them separate for clarity. However, keeping this in mind, the first graph becomes more meaningful: moving to the left, at around 0.03 ug/mL BSA the adsorption (in terms of number of BSA molecules) begins to drop, leaving room on the PDMS/glass for enzyme to be adsorbed and thus reducing the apparent concentration of enzyme in the sample when it’s assayed later. Pleasantly, this perfectly explains the loss of enzyme in my previous post: the enzyme placed in the bottom well and then tested 24 hours later and found to be missing would’ve been in a concentration of 0.029 ug/mL if it had not been adsorbed at all.
What’s really weird then, is that as we continue to move left on the graph, the fluorescence goes back up. This is so weird to me that I ran another completely separate test at these same concentrations, and confirmed that the valley shape made by the data points between 0.064 and 0.00256 ug/mL is really there and not just due to noise or measurement error. It also could not have been caused by a simple mistake in making the 0.0128 ug/mL solution (wouldn’t it be pretty if that point had been between the other two rather than so low?) because since the solutions were prepared by serial dilution, accidentally reducing the concentration of the 0.0128 ug/mL would reduce the concentrations of all the solutions below it by even more.
Arguably weirder still, are the last three points. The graph reaches “effectively no protein” around 3 pg/mL (of course) but for some reason all three of the last three points (getting down to 52.4 femtograms per milliliter — what experts are calling “absolutely nothing”) show some significant enzymatic activity. This obviously has nothing to do with the protein (I shouldn’t have even bothered testing these “concentrations” of BSA,) so it’s a bit worrying that they don’t look the same as the positive control. Before I quit and start up a homeopathy clinic, I think I need to collect some more data.
I can not personally explain away these two weird happenings, so in the coming weeks I’m going to collect data in these areas of the graph in a higher resolution and with a bit more care. I’ll be making some plasma bound assemblies and running more tests to confirm or explain these discrepancies from my understanding of the phenomena at work. This may take a bit longer than usual — with classes starting this Tuesday, I’ll be working only about a quarter as many hours per week as I currently do. Nevertheless, I’ll do my best to continue being productive and updating the blog on my efforts. Hopefully this can be cleared up and the FLAG tests can be returned to completed in a reasonable time.
I think you are basically reconfirming the need for blocking steps and “carrier proteins”, all very standard in assays like this.
I would not worry about digging in the dirt at the bottom of your concentration curve. You will ultimately find an unsatisfying answer related to small differences in buffer formulation, storage conditions, material variability, experimental timing, etc. I think the important thing is the roll-off that you see, so I would call it a success and move on.
Incidently, I’m not sure how you chose your titration curve values, but they are pretty far from standard. When you buy a small amount of protein, it often comes with a carrier of 5-10 mg/mL BSA or a 10% FBS background or equivalent. This ensures that the precious couple ug of protein does not just stick to the vial surfaces and disappear. I think this is the same issue that you are trying to fix. Blocking of surfaces in assays is also done in the mg/mL range, which you barely touch here. Anyway, if you had asked me, I would have suggested starting at a ug/mL and going up to 100mg/mL or so, but then you would not have seen the nice roll-off, which is probably useful.
I think the bigger issue is what is needed for CytoVu to be useful to researchers. Do we recommend blocking steps, carrier proteins, or block the surfaces with small molecules prior to shipping? The issue with treating the surfaces is that we have to do it after assembly, as the bonding step requires bare surfaces. Ideally the pieces should be pre-blocked before assembly, and then assembled without plasma bonding, but we currently have no alternative bonding strategy. I think working toward this solution would be a very valuable use of time.
Thanks!
It was discussed earlier during the summer that mortar bonding might be a good alternative to the plasma bonding that is currently standard. Unfortunately, the PDMS which is used as mortar would also need to be blocked after assembly, so I doubt this really solves the problem.
If we discount blocking before bonding, that leaves blocking before incubation in the CytoVu well and carrier proteins. Unless you think something else would be more prudent, I will test the effectiveness of these two options against untreated samples at a few mg/mL and proceed back to the FLAG tests with whichever results in the least protein loss. Assuming they’re comparable, I suppose carrier proteins would be the preferred solution simply because it requires less incubation time.
If it’s common practice to sell proteins with carriers, then I imagine that recommending BSA (or any protein, I suppose) be included in the buffer used for incubation would be a trivial inconvenience to researchers.
Thanks for your help!