Continued analysis of SiN-NP permeance and permeability
Following up on our previous work with SiN-NP with varied RIE times, Sarah and I measured permeability and permeance using a new measuring system better suited to the higher permeance and permeability we expect with the larger pores and higher porosity.

Using the pressure regulator pictured above, we can set pressures of 3 psi and above and it stays relatively stable with time. Pressures below 3 psi however tend to be erratic.
The following images simply show the pieces of the the new(‘-ish’) flow cell we are using to measure permeance and permeability.

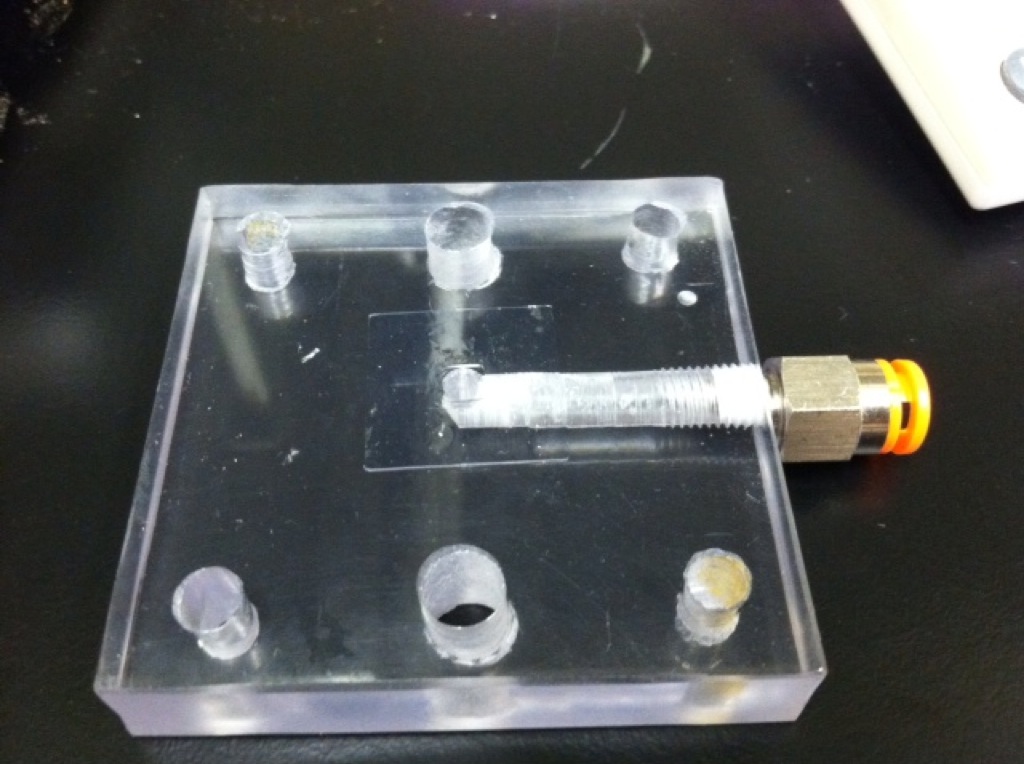
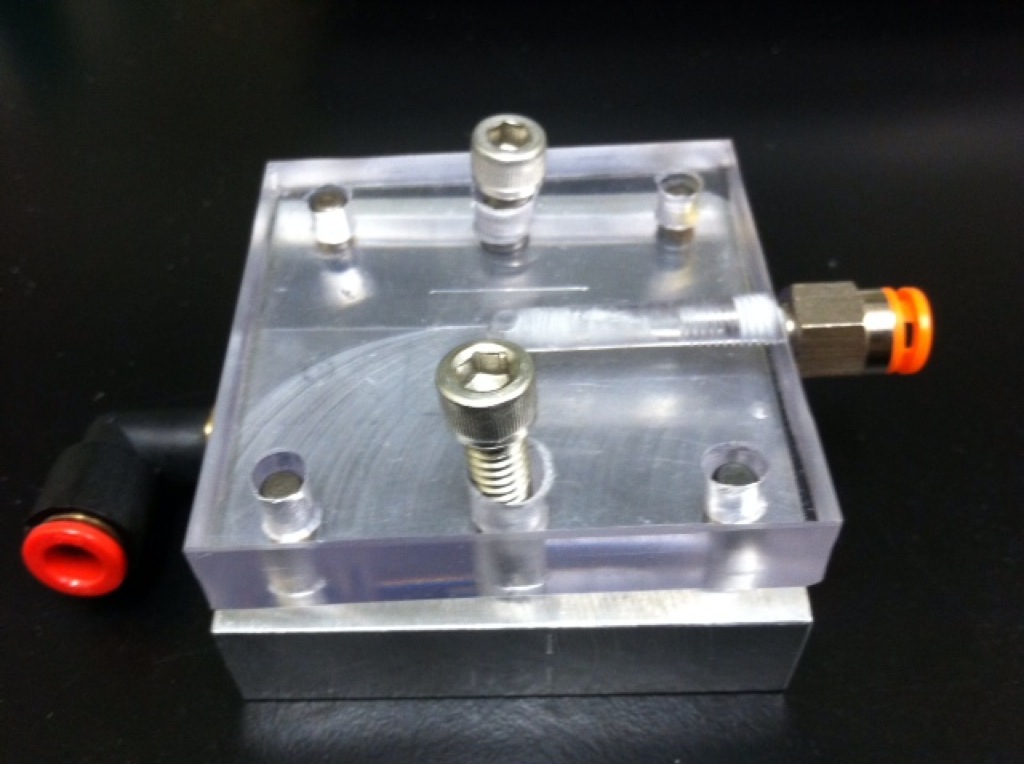

We used super-glue to fixe the o-ring to the Al base and the silicone gasket sticks to the polycarbonate top, making loading and unloading samples easy.

Using the “FLOWMETER 2000” pictured below, we calculated that each increment of green the flow meter tube is equivalent to ~0.74 ml/s. We force nitrogen passing through the green flow meter tube into the top of the bottle which in turn forces the water up through the tube and into a separate collection beaker. The volume of water displaced over a specified time gives the actual flow rate of the green flow tube. We tested the flow rate at setting of 5 and 10, but in the future we should get more data to better calibrate the scale of the flow meter tube.

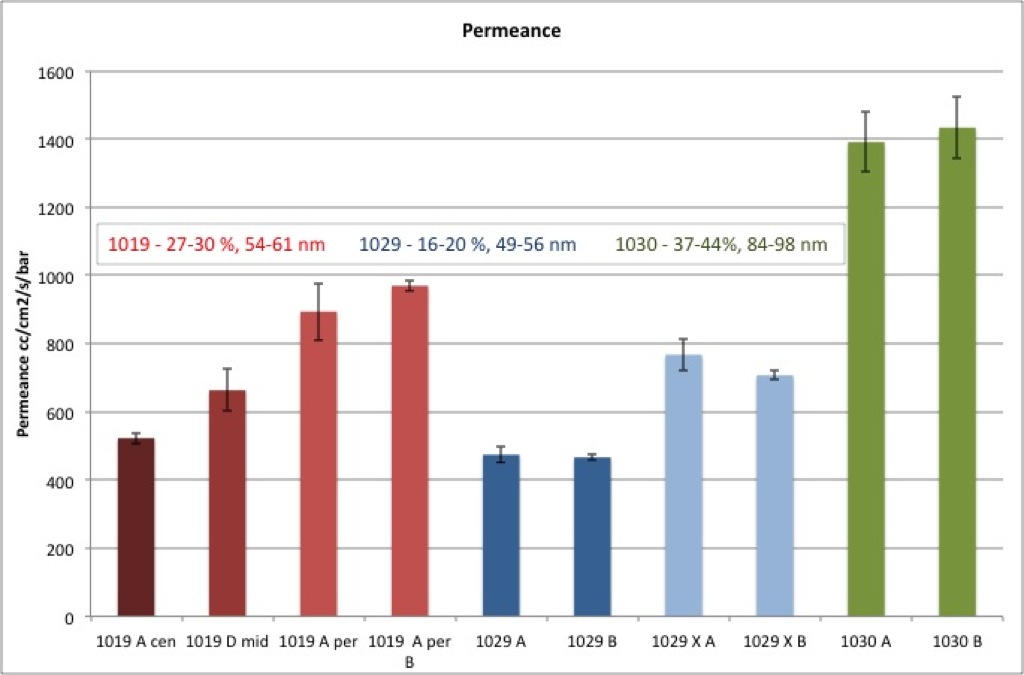
A 5-slot SEPCON with all windows removed had a permeance of ~14,000 cc/cm2/s/bar. The trends in the permeance data generally make sense. It’s not clear why the 1019 samples from the center have a comparable permeance to that of the 1029 samples given that the porosities are as different as they are. We will try to figure this out with further study.
Okay, that was the easy part. Now we need to discuss hydraulic permeability. The nice thing about the new cell is that we can easily load it with a large volume of water in the tube preceding the cell, unlike our previous method of loading 500 uL max in a SEPCON top bucket and trying to time it’s passage.

Depending on the flow rate of the filter, we either capture the water in a beaker and weigh it after a fixed time, or we measure it’s flow through a graduated pipette as picture below.

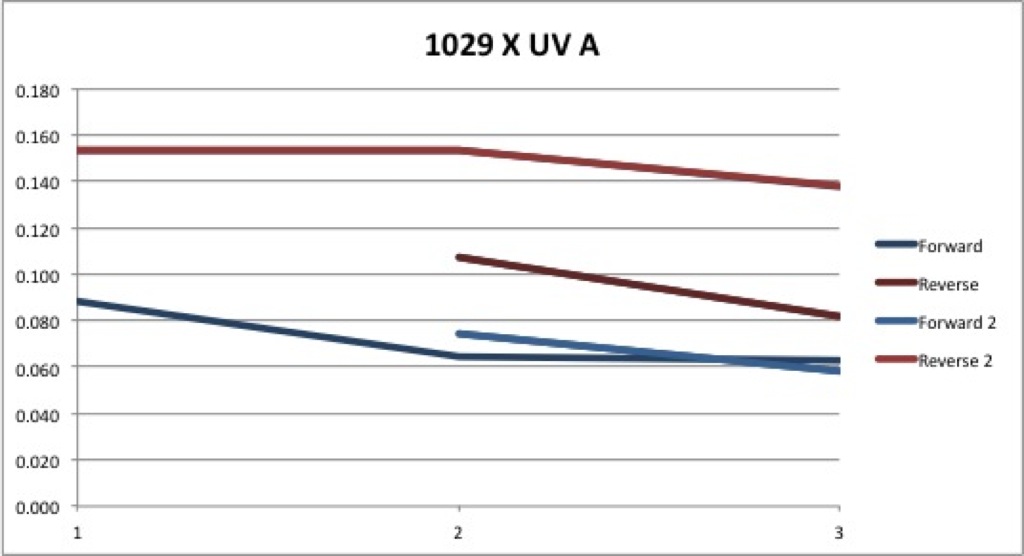
The problem we are having with the ability to flow large volumes is the resulting fouling we are experiencing. We rinsed out all the parts of the cell and filter the water from the Barnstead with 0.2 um filters before loading into the cell. As the following plot shows (hopefully), the flow rate decreases fairly rapidly with time/volume passed.

The flow starts out relatively high on line “Forward 1” and then decreases quickly until we stop measuring after passing 400 uL. We then reverse the flow by pressurizing the opposite end of the flow cell. In the plot, the sequence of flow is in the direction of the arrows, so the initial flow rate of “Reverse 1” is at 5 on the x- axis and increases after flow 400 uL in the reverse direction. The flow is then returned to the forward direction and it begins similar to the flow observed at the end of the first forward series. The flow does not change much other than dropping slightly as an additional 500 uL is passed through the filter. Finally, the flow is reversed yet again. Although the flow is higher in “Reverse 2” than in “Forward 2”, it remains below the rate of “Reverse 1”. This isn’t that surprising if one assumes that the filters are clogging. It’s surprising that our water is that dirty. We just bought some “clean” water from the Med Center and will try it out with the filters. We are also looking to service the Barnstead to make sure it’s doing its job.
While I like the plot above because it’s interesting to think about, I also hate the plot above because I can’t decide how to turn it into a number. If we choose to focus on the initial flow rate we are probably closer to the theoretical hydraulic permeability of the membrane. Unfortunately, we were more interested in getting a long running average and didn’t realize how important it was to capture the first 100 uL passed, so we often missed this data. I thought about averaging the flow rate over all points, but because we flowed in both directions, that doesn’t seem fair to do.
So as I type this I’ve decided to average the first 3 points we have in the forward direction and leave it at that. In the future, we will do a better job of capturing t=0.
For now, I’ll provide several of the plots similar to the one above with the average of the first 3 points in the forward direction below the chart:

1019 E Avg. = 0.2 cc/cm2/s/bar

1029 E Avg. = 0.09 cc/cm2/s/bar

1029 C Avg. = 0.08 cc/cm2/s/bar

This sample was UV ozone treated by Tejas on JP’s suggestion to see if it would affect the permeability. It seems that it may have increased it slightly, but again, it’s hard to say given the large variation in all of the data.
1029 UV C Avg. = 0.117 cc/cm2/s/bar

This sample had the pnc-Si stripped by JP and Josh Miller using the Xactic Si etcher at RIT, so it is just SiN. We saw this increase the permeance, but it has not had an obvious affect on the permeability.
1029 X A Avg. = 0.05 cc/cm2/s/bar
This sample had the pnc-Si stripped and then received UV ozone treatment.
1029 X UV Avg. = 0.07 cc/cm2/s/bar

Avg. = 1.02 cc/cm2/s/bar
As a control, we used SiN-NP wafers that recieved a 50s RIE resulting in no remaining membrane over the window. So a 5-slot SEPCON with no windows, or 100% porosity has a hydraulic permeability of ~2435 cc/cm2/s/bar. We measured a similar chip flipped upside down, so that the flow passed from the front of the wafer towards the back. (through the window, then the trench) and calculated the permeability to be ~1900 cc/cm2/s/bar. We need to repeat these measurements using the same chip forwards and backwards to determine if this difference is real or not.
With no chip at all, the permeability measured was ~ 9500 cc/cm2/s/bar.
Finally, I used the matlab code that calculates the theoretical permeability. The following calculations all seem to be an order of magnitude higher than we are measuring.
1029 c4 5psi 80nm = 5636 ul/min/psi/cm2 = 1.4 cc/cm2/s/bar
1029 c4 5psi 60nm = 6832 ul/min/psi/cm2= 1.7 cc/cm2/s/bar
1030c3 5psi 40nm = 50800 ul/min/psi/cm2= 12.3 cc/cm2/s/bar
1030c3 5psi 60nm = 42670 ul/min/psi/cm2= 10.3 cc/cm2/s/bar