A New Round of Separations Still Shows an Increase in Filtrate Flux Above Normalization for Larger Active Area Sepcons
Using methods pretty much identical to those outlined in Tuesday’s post, I was able to get very similar data for a different BSA concentration. Whereas Tuesday’s curves were all done with 1mg/mL BSA, this was done with 0.5mg/mL BSA.

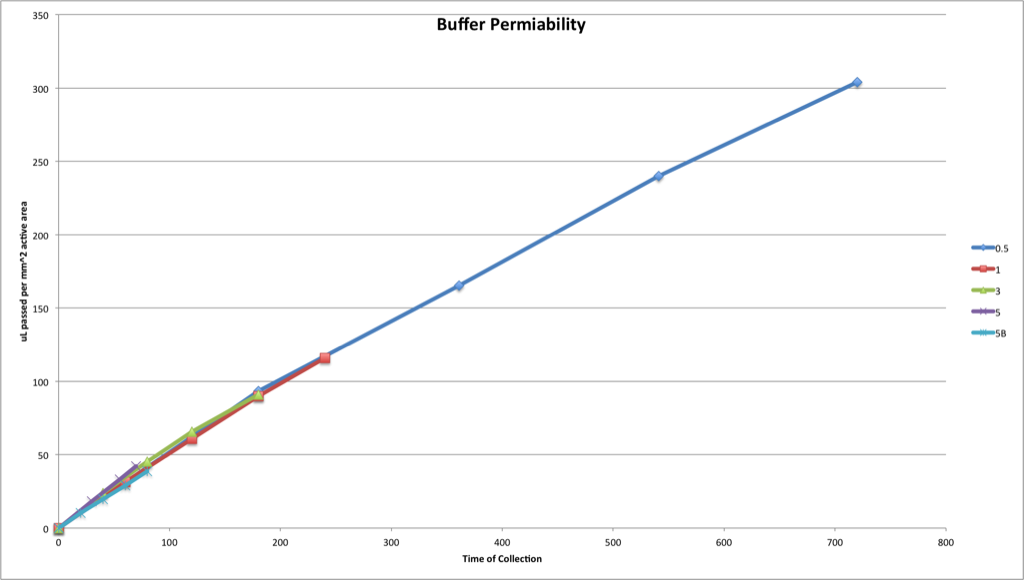
The first time I collected sample from the 5 slot chip during the buffer separations, I let each collection time run too long, such that I only got three points before I worried about emptying the sepcon. So I refilled the Sepcon with buffer and re-collected – that’s what 5B is in the chart above.
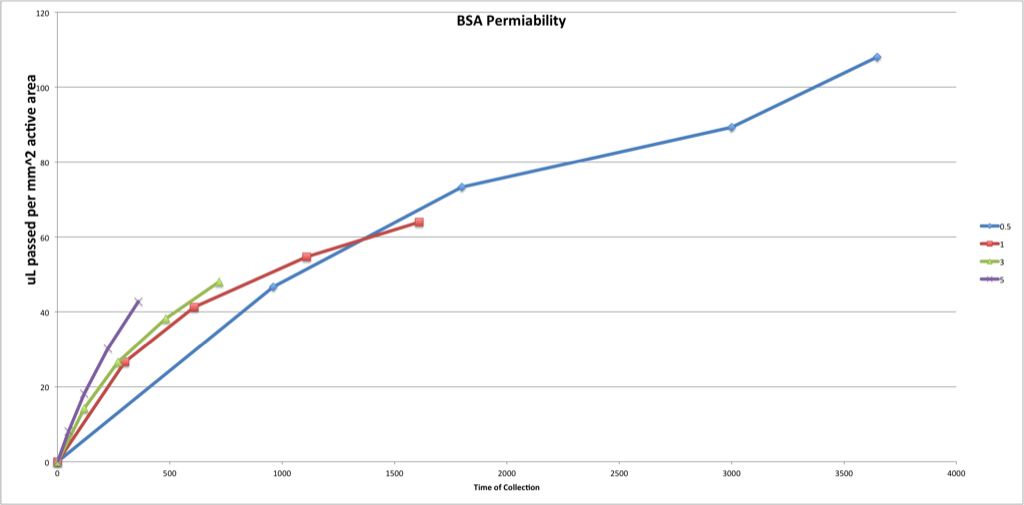
I made a mistake in my vial scheme at the beginning of the half-slot BSA series of filtrations – this could have added a volume of fluid to what I measured as the flux; that might explain the weirdness of the 0.5 slot in the last graph. Generally, the 0.5 slot data sets are the hardest to collect – the volumes are much smaller, and whether a little bit gets left on the underside of the Sepcon begins to matter a whole lot more.
When we spoke at NRG I tried to argue from streamlines that concentration polarization was dependent on the geometry of the Sepcon. I’ve since been dissuaded from that interpretation, and I think instead we should think about this in terms of cake layer formation. We know from previous experience that a cake layer always forms when we flow enough protein through the membrane, and I wonder if perhaps inactive area promotes caking in some way. The answers, I’m pretty sure, are buried somewhere in this paper: A combined pore blockage and cake filtration model for protein fouling during microfiltration.
Permeability not Permiability
Lets use permeability values of ml/(min-cm^2-bar). This way we can compare to the ACS nanopaper to at least know if we are in the ballpark of reality. The max value in that paper is 40 ml/(min-cm^2-bar) for 13 nm average pores and 14% porosity. You really need to get the theory working on your computer (MATLAB model) and plug the full histogram data into the model to get the theoretical predictions.
I convert your permeability values with protein to something close to ~ 25 ml/(min-cm^2-bar) and without protein to more than 100 ml/(min-cm^2-bar). These are very high but given that your pores are twice as large and your porosity is half as much – perhaps these make sense. Still, the values with protein would be very impressive and I hope they are correct.
On cake formation … Right! The difference between passing 1 ml of material through a 0.5 slot and a 5 slot is the amount of protein that each unit area of membrane had to process. Since there is a lag between the protein flux and the water flux, the smaller area sees a bigger build up. Pretty simple. So the correct plot would be permeability as a function of volume passed per unit area of membrane. These should decay at the same rate for all of the curves.
These curves make more sense. Do you think they are within the margin of error to the overlapping scenario of the PBS curve above? Have you tried to repeat the 1mg/mL result? With the area-normallized variables on these plots, all these curves for all solutions should overlap.
Thanks!