Bottom SiO2 Thickness Experiment(1)
The thickness of bottom oxide in the ‘sandwich structure’ is also a key factor to affect the pore morphology. In last few weeks I deposited five wafers with different bottom oxide thicknesses and they were 05/15/20, 10/15/20, 20/15/20, 40/15/20 and 100/15/20. Then I annealed them at 1000C for 1 minute with a 100C/s ramp rate. Below are TEM images, porosity, pore distributions, average diameter and pore density plots.
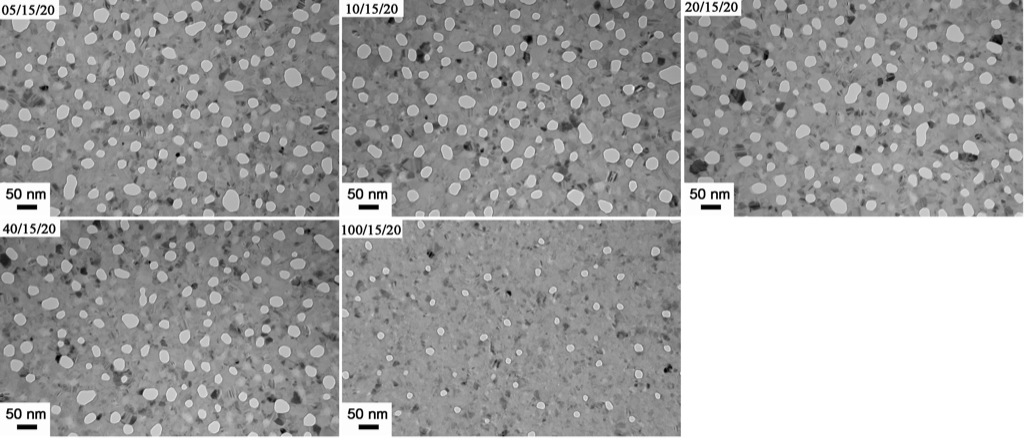

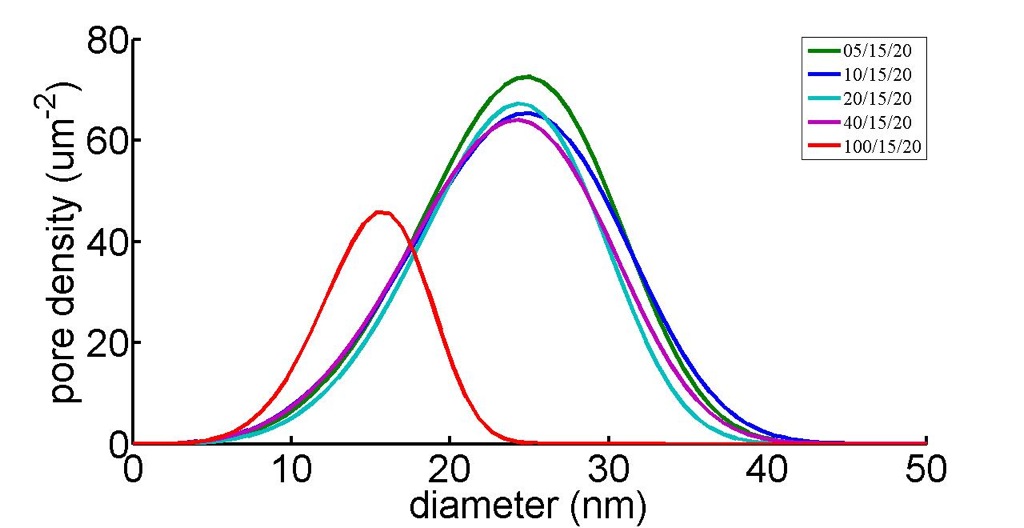

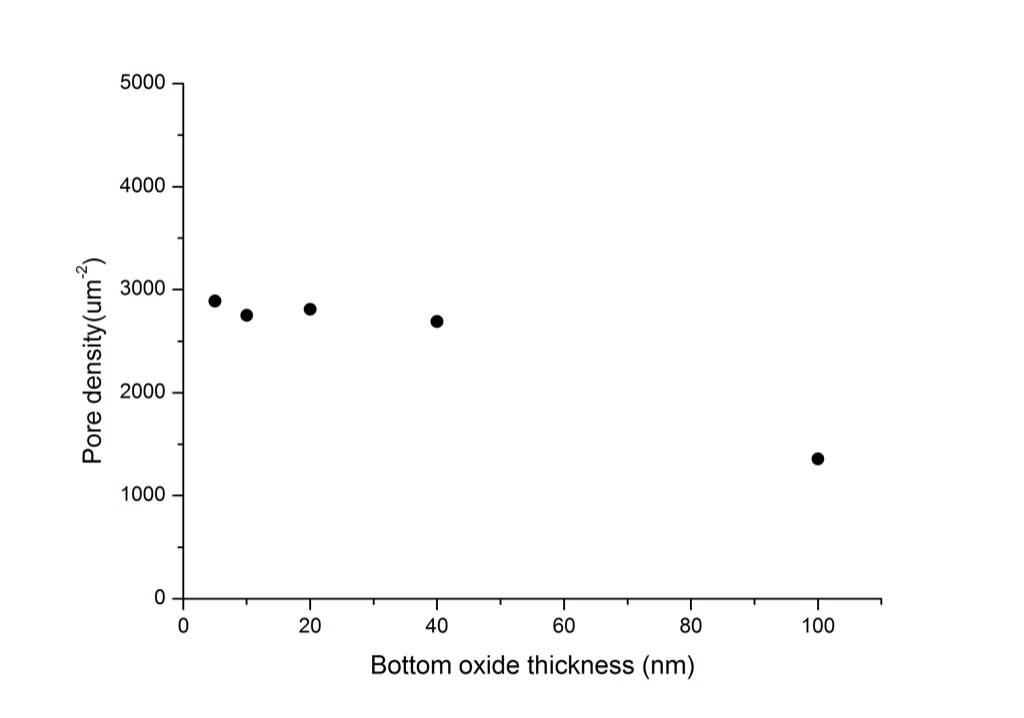
From the TEM images, it can be seen that the thinner bottom oxide samples, like 05/15/20, 10/15/20, shows higher pore density and pore size compared to lower pore density and pore size in thicker bottom oxide sample, 100/15/20. The porosity plot strongly proves this phenomenon and interestingly, the porosity decreases with the bottom oxide. When the bottom oxide thickness increases from 5nm to 40nm, the porosity slowly decreases from 14.5% to 12.6%. However, the porosity drops to 2.5% when bottom oxide increases to 100nm, which shows a very big decrease rate. Similar trend is also observed in the average pore diameter plot and pore density plot. Especially in pore distribution plot, it can be clear seen that the pore distribution of 100/15/20 sample is very different from the others, which reflects the great decreases in both pore diameter and density. So it looks that the pores are more ‘sensitive’ to the bottom oxide. The porosity, pore size and pore density decrease with the bottom oxide and the decrease rate is going up when the bottom oxide goes very thick-several times thicker than Si layer. It is possible that no pores would form when the bottom oxide reaches to a critical thickness.
Another thing I noticed is that the crystal size in the 100/15/20 sample is smaller than those of the other four. If we assume that the crystallinities of those five samples are almost same due to same annealing temperature and ramp rate, then it means that the Si crystal density is larger in the 100/15/20 sample. It further means that the pore formation and pore growth would be hindered due to high dense Si crystals during the crystallization of amorphous Si. So it seems that thicker bottom oxide in the ‘sandwich structure’ enhances the crystallization of amorphous Si somehow by affecting the strain state of the whole structure(?).