Zeta Potential Measurements for PES and Cellulose
Using streaming potential data collected via the flow device Jess created, I have attempted to recreate the Zydney findings for membrane zeta potential. Ag/AgCl electrodes were used in 10mM KCl, mimicking identically the method outlined in Zydney. Data are below:

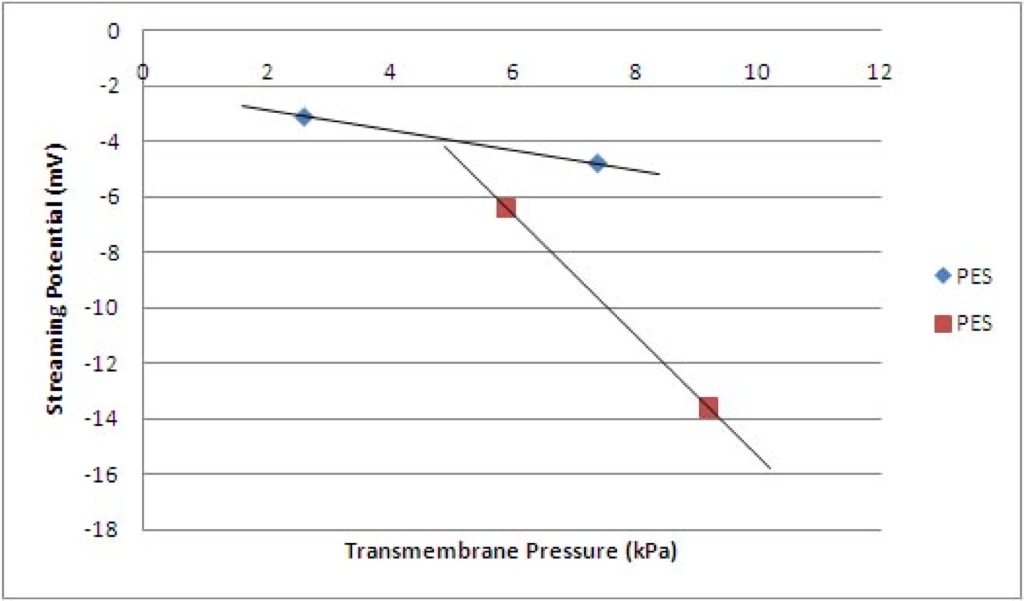
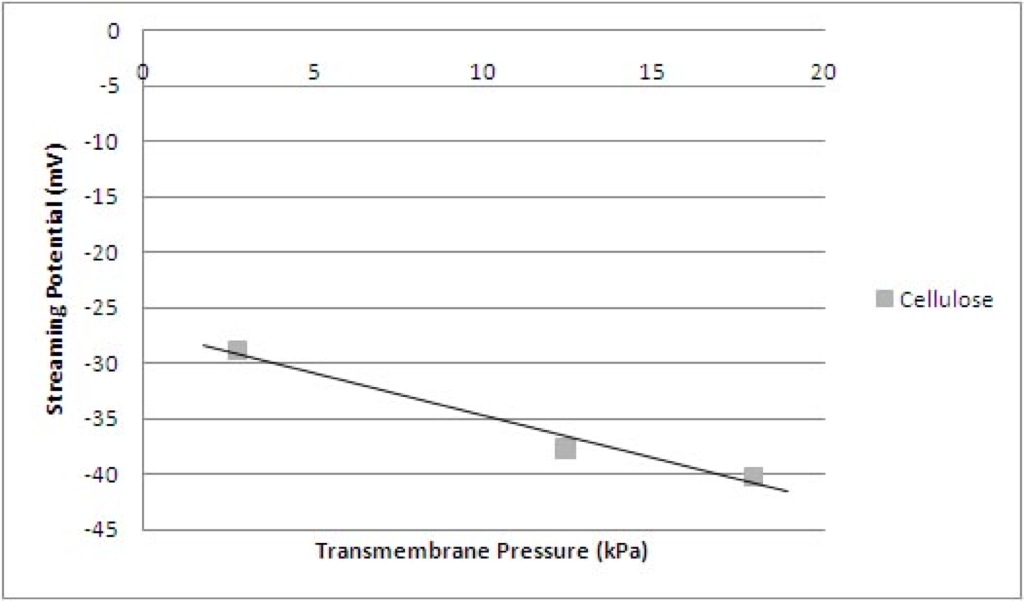
The streaming potential for both trials of PES membranes varied significantly after 60 minutes in both cases and dropped back towards their initial value. Because of their unreasonableness, I chose to exclude them from the plot. The Zdyney equivalent of the graph is below. Zydney calculated streaming potential to be around 9mV, I calculated between 1 and 2mV. Differences in electrode preparation introduced a very large variance in streaming potential stability throughout the trials. The zeta potential values of the cellulose, while supporting the shape of the expected results, are not valid as direct measures because the initial potential was not recorded.

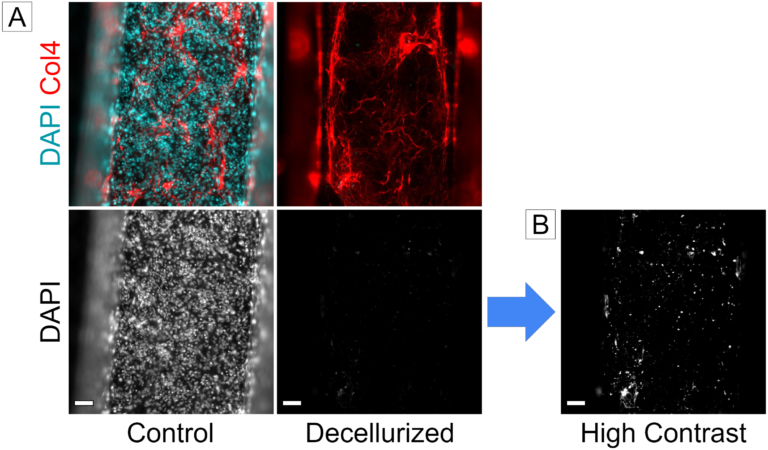
Sample data for the streaming potential of a Biomax™ membrane in a 10 mM KCl solution at pH 6.5. The open symbols represent repeat measurements with a single membrane. The closed symbols represent data for a second Biomax™ membrane under identical conditions.

These values were calculated using only two data points, making them valuable for relative comparison only. I plan on continuing PES trials until I can get at least three data points supporting the Zydney conclusion. If the issue I have been experiencing persists, I will investigate the existence of some systemic issue (if so, hopefully it was experienced by Zydney’s group as well, and hopefully they are open to sharing that info). The cellulose trial was the first trial I conducted while learning how to use the system. Whether or not it has relevance lies in my continued literature search and investigation.
Zydney’s measurement is for cellulose?
What are you doing next?
This post was updated on 11/16 to clear up some confusion – Jim, your answers are in the last paragraph!