Characterizing Endothelial Cell S1P Receptor Expression via Flow Cytometry
Introduction
Much of the background information for this set of experiments can be found in my previous post. In short, endothelial cells mainly express two receptors to the sphingolipid S1P, S1PR1 and S1PR3. S1PR1 is characterized as a barrier enhancing signaler, while S1PR3 appears to elevate vascular permeability while promoting leukocyte capture. Based on TEER results, we wanted to characterize receptor expression on the surface of both HUVECs and HPMECs and correlate these findings to said results.
Methods
HUVECs (Vec Technologies) and HPMECs (PromoCell) were maintained in T-25 flasks until experimentation. Flow experiments were performed in triplicate on sequential passages of each cell line. For flow cytometry, cells were trypsinized and counted. Cells were washed and resuspended in flow buffer (1X PBS plus 1% BSA and 0.1% sodium azide) at 50,000 cells/100 uL. 100 uL of the cell/flow buffer solution was transferred to 1.5 mL epindorph tubes and placed on ice. Cells were incubated with single, or dual antibodies to S1PR1/3 (vendor listed in Table 1) for 30 min at 4-8 C in the dark. Concentrations for labeling were based on manufacturer recommendations (1 ug per 10^6 cells). Following incubation, cells were washed three times with flow buffer (epindorphs filled with buffer, spun at 200 g for 5 min). After the final wash, cells were resuspended in 200 uL of flow buffer and stored on ice.

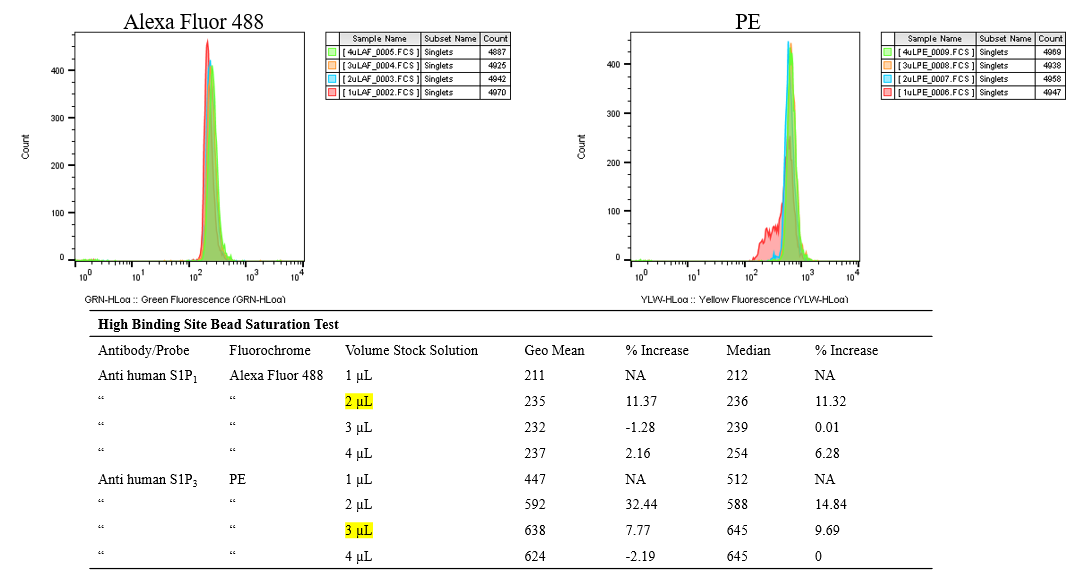
In combination with cell staining, Quantum Simply Cellular Mouse IgG calibration beads were stained with both receptor antibodies individually. In using these beads, antibody binding capacity (ABC) can be estimated for each receptor, allowing for direct comparisons of receptor surface expression within and across cell lines. Prior to staining, optimal antibody staining concentrations were determined: highest ABC beads were stained with varying amounts of Ab until the observed geometric mean saturated with increasing Ab added (Figure 1). All data analysis was performed in flowjo.
As a non-formal side note: there are a plethora of incredible resources both online and with the flow cytometry core in URMC to help get started. If there is any interest in running flow for future work, it is important to understand exactly what you want to get out of the study, which will allow you to properly plan your experiments.
Results
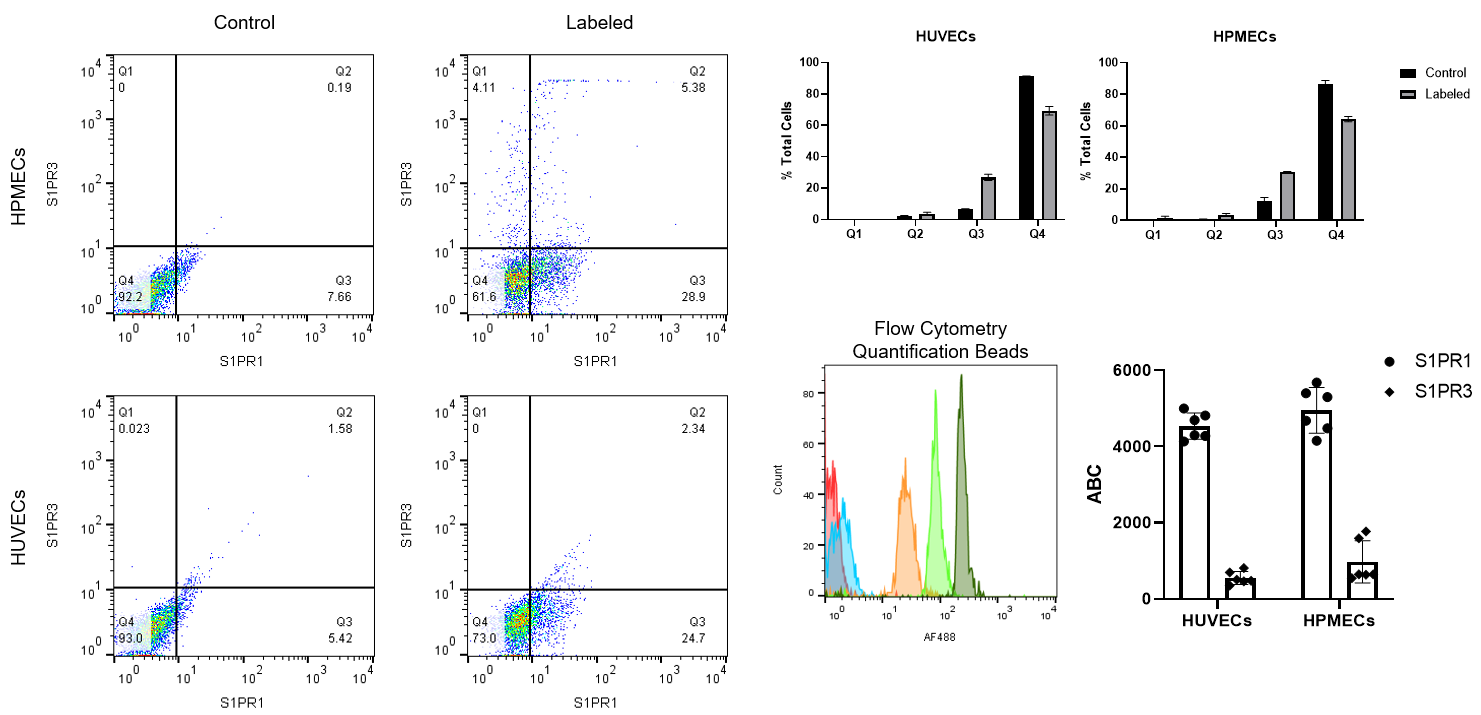
ABC data appears to be relatively consistent between cell lines and receptors. However, the dot plots tell another story. In fact, it appears that HPMECs are more likely to show high S1PR3 expression on a select population of cells. If you can imagine these cells in a continuous monolayer, these S1PR3-high cells may act as a faulty brick in a tightly packed wall. Once S1P is exposed, these cells may retract and permit elevated monolayer permeability. This hypothesis is evident in our TEER data which showed HPMECs more susceptible to barrier disruption following S1P exposure.
Conclusion
HPMECs on a single cell level are more prone to a S1PR3-high phenotype, potentially facilitation barrier disruption when placed in a continuous vascular monolayer.
Acknowledgments
Elena Lomakina in Dr. Waugh’s lab was extremely helpful in getting this work started, so while we don’t usually acknowledge within the group posts, she deserves recognition for this work.