Sieving Curves for 50, 75, and 100 nm thick NPN
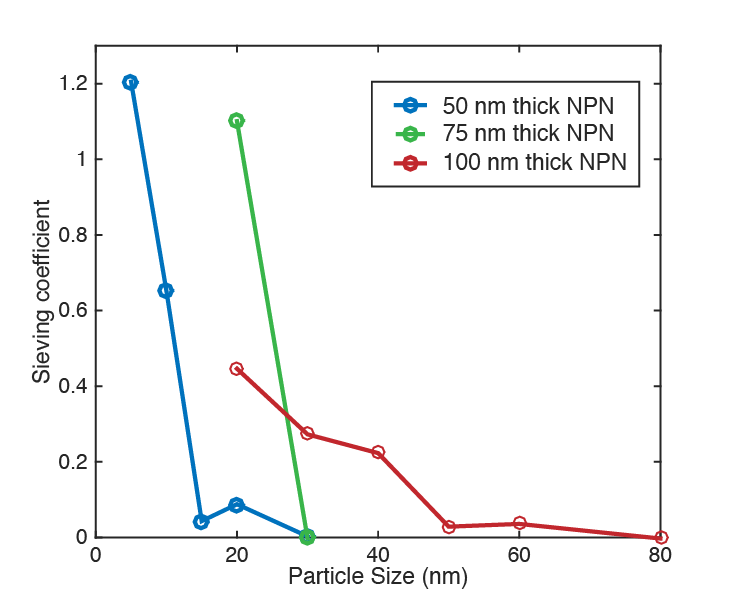
These are the sieving curves for 50, 75, and 100 nm NPN membranes. The 75 nm NPN 30 nm gold data point is just an estimate, since the membrane broke before enough filtrate could be collected for an absorbance measurement. However, our estimates of zero gold tend to be pretty good (gold is very visible in solution, and this particular filtrate was colorless). Also note that hydraulic permeability for the 75 nm NPN membranes fell precipitously when 30 nm gold was used, with ~20 uL of fluid passing after 2 hours spun at 3000 rpm, as compared to ~60 uL of fluid passing after 30 minutes when 20 nm gold was used.
The sieving coefficient > 1 is probably due to a small amount of evaporation taking place in the tubes – I typically waited ~18 hours to run the samples through the Tecan. We could probably adjust all the data points by multiplying by a correction factor reflection this (so that each data set’s > 1 number becomes 1) but that’s getting a little dicey.
Additionally, we found after filtering unconjugated Siteclick 625 Qdots through a 50 nm thick NPN membrane, the concentration of Qdot in the filtrate was <0.01% of the starting concentration (N=3) as measured by fluorescence intensity (ex. 400 em. 625).
After filtering IgG through a 50 nm thick NPN membrane, the concentration of IgG in the filtrate was 86% of the starting concentration (N=1) as measured by absorbance: ((Abs@280 – Abs@250) + 0.004521)/0.052
The following excel spreadsheets contains the raw data: 5.18.17 gold IgG Qdot // 5.18.17 PART II (PART II contains all the Qdot data, as well as a second IgG measurement that was of poor quality that I ended up excluding)
SVG files of curves: SVG files
The MATLAB code used to generate the SVG files (zipped, 6 .m files): Calculate Sieving Curves
IgG concentration and QDot concentration were calculated in the excel spreadsheets.
The way the MATLAB code works is like this. Raw data is inputed via this formula (screenshot from MATLAB code file):
Ignore the label “raw2226” – it’s just the data set of interest in each plot. Water is the absorbance from a water measurement (a blanking step) before each gold measurement. Absorbance is the raw gold absorbance. Both are measured at the wavelength indicated in the comment (5 nm @ 524 nm, 10 nm @ 522, etc.). If you take measurements in triplicate, they go in sets 2 and 3, but if you have only one point, leave the remainder of the gold sizes at 0.
Gold concentrations are calculated based on dilution curves saved in the matlab file “linear gold fits”, and are zeroed using the blanking measurement.
The matlab file “realgold” generates the x-axis error bars based on TEM images of the actual gold nanoparticle sizes. It has been disabled in this graph, since we don’t have TEM images of these populations. Similarly “errorbarxy” allows for easy plotting of graphs with x and y error bars, but has also been disabled.
Nice data, Karl.
Looks like the 50 nm will work for the reverse SepCon Dot separation application.
Do you know the size of the Dots you used here?
BTW: there is a new naming convention for NPN with oxidized pnc-Si templates. The first number refers to the thickness of the pnc-Si template, followed by its oxidized designation, then the silicon nitride thickness. For the NPN types tested here, their names would be:
• 20/Ox/50
• 32/Ox/75
• 40/Ox/100
For future reference, I believe you used NPN-O instead of NPN.