After reading and discussing a paper in journal club that talked about cells having a “mechanical memory” (found here “Mechanical memory and dosing influence stem cell fate“), we decided to replicate our previous YAP/TAZ experiments with passage one HUVECs direct from Life Technologies as to avoid making our cells “remember” that they had ever been plated on tissue culture plastic. To save you some time, the “mechanical memory” paper discussed the fact that if cells even saw tissue culture plastic (a very stiff substrate) for several days, once they were plated on a soft substrate, they would still act like they were on a stiff substrate because the cells could “remember” that they were on a stiff substrate. They also said that this could impact the differentiation of the cells and that MSCs might be much more prone to differentiate into osteoblasts if they were ever on a stiff substrate. The group also included a photostiffening hydrogel in their experiments and showed that “dosing” the cells with a stiffer substrate before plating them on a softer substrate increased the amount of time it took for the cells to express YAP and RUNX2 like they would if they had never been plated on a stuff substrate. This got us thinking that passage 5 might be too much time on a stiff substrate for cells to truly act as if they were on a soft substrate, thus interfering with our experiments that explored the relationship between pore size and apparent stiffness. To test the hypothesis that cells do have a mechanical memory and will be impacted by the substrate that they had previously been on, we simply altered the protocol from our first YAP/TAZ experiment to utilize P1 cells. I also included 05μm LP membranes to briefly look into how a lower porosity also impacts the expression of YAP/TAZ. Also, the number of HUVECs was reduced as it seems that the cells express less nuclear YAP as the substrates become more crowded. The antibody incubation period was also increased to one hour.
Methods:
For the substrates we wanted to use 0.5μm HP, 0.5μm LP, 3μm HP, TCP, and nonporous SiO2. Cyto-Vu devices were made using the above substrates and 500 HUVECs were seeded per membrane. The cells were allowed to adhere to the substrate for 1 hour and then the wells were flooded with 800uL of media. After 3 days, the cells were fixed in 3.7% formaldehyde for 15 minutes, permeabilized with 0.1% Triton T-100 for 3 minutes, washed with 4% BSA for 15 minutes, and 100uL of the YAP antibody (0.2mg/mL was diluted 1:100 in PBS) was added on top of the substrate for one hour.
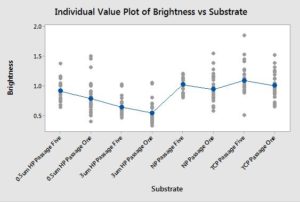
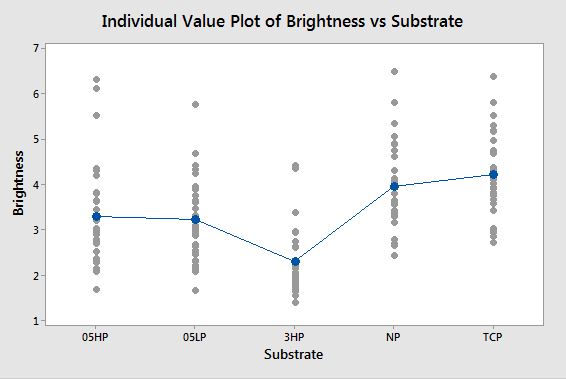
The images were acquired and analyzed in image j. The nucleus’ brightness was measured as well as the background and the cytoplasm of the cell. To analyze the data, the background was subtracted from the values for the nucleus and the cytoplasm. Then, the intensity of the nucleus was divided by the intensity of the cytoplasm. Sample sizes were at least 20 cells. The results are as follows:
0.5μm HP:3.29
0.5μm LP:3.22
3μm HP: 2.23
TCP: 4.21
Nonporous SiO2: 3.82
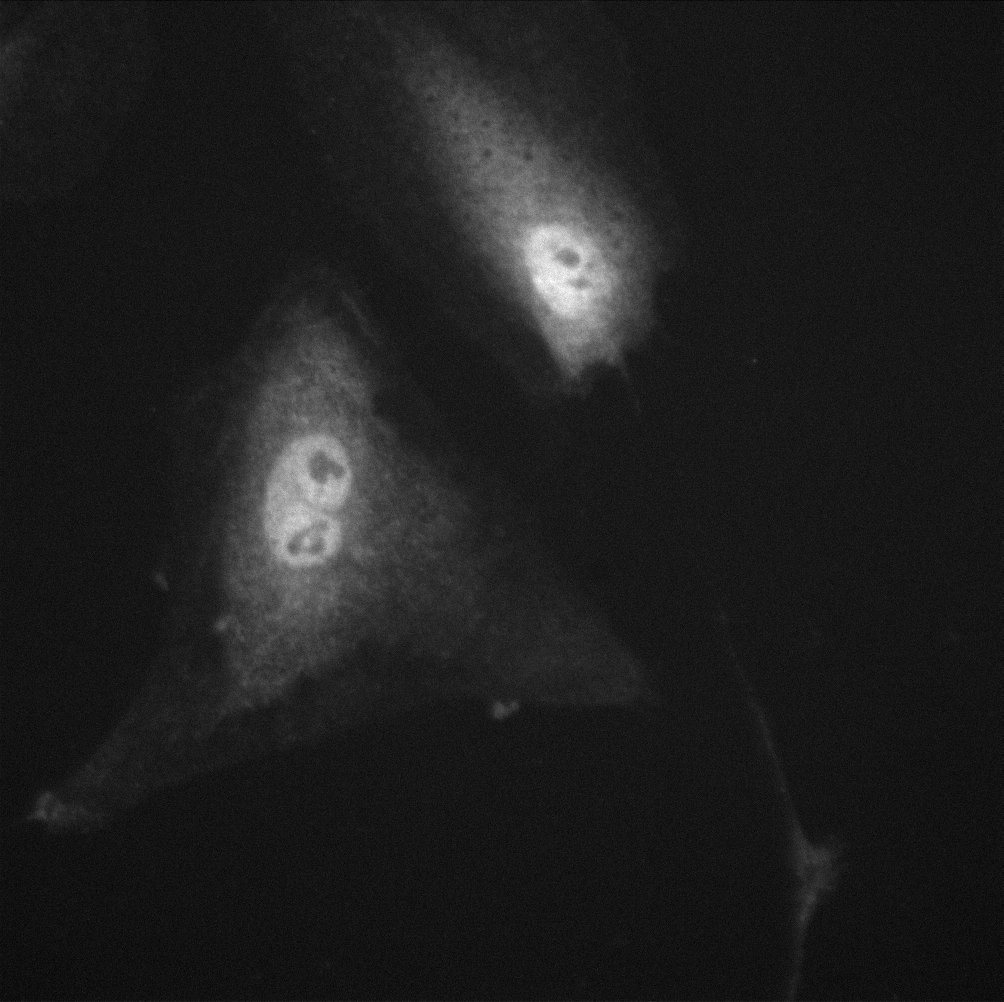
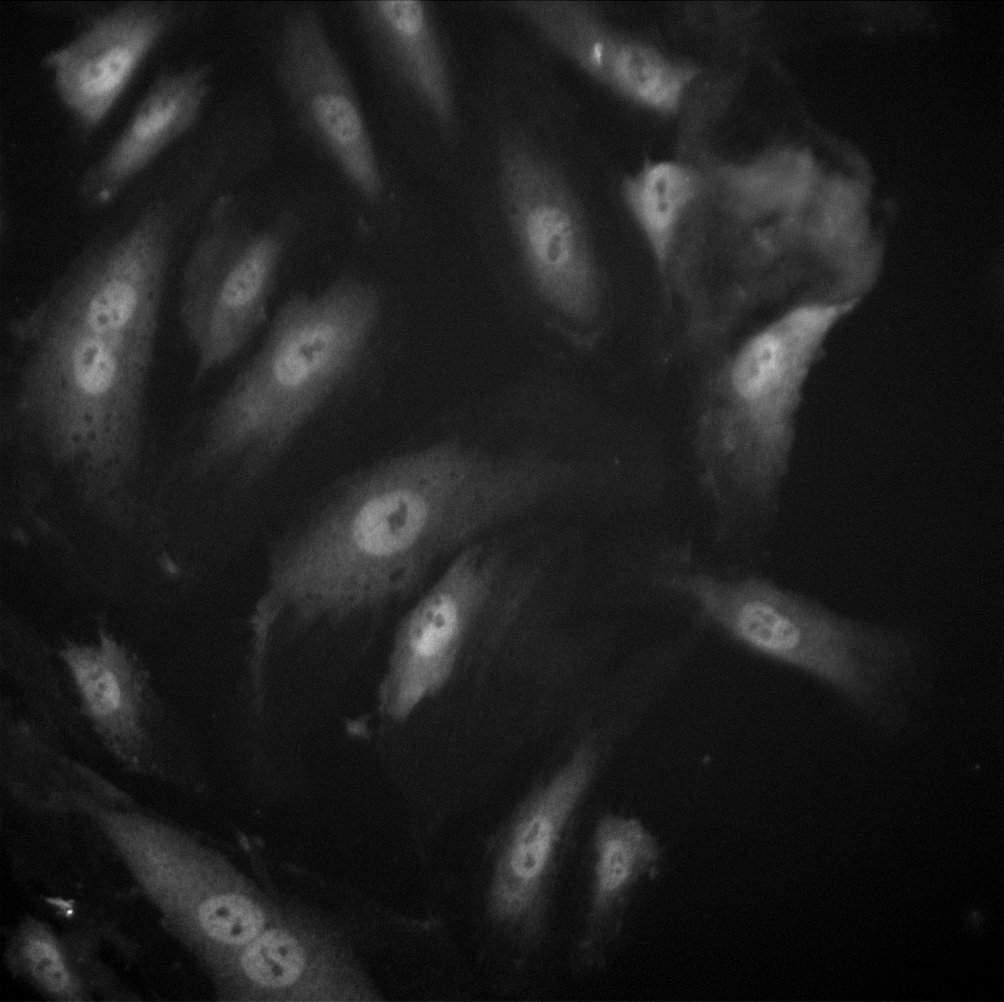
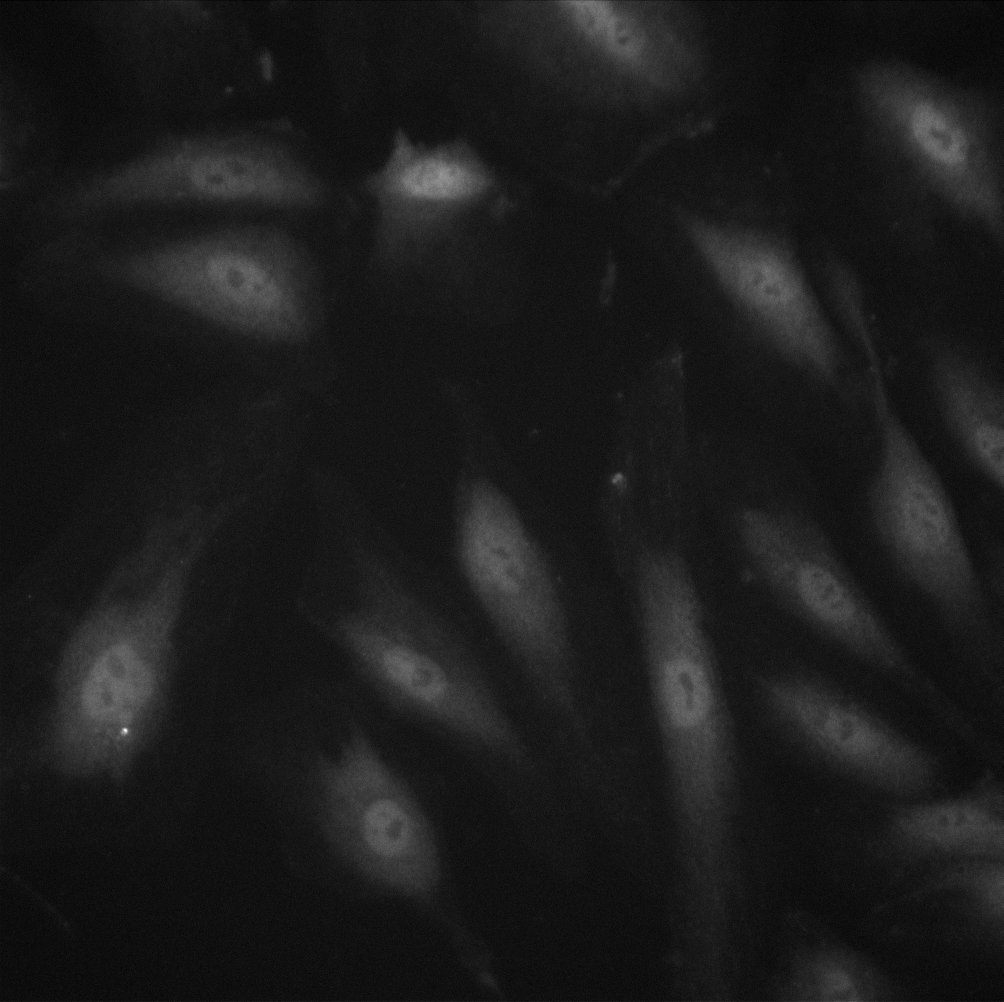
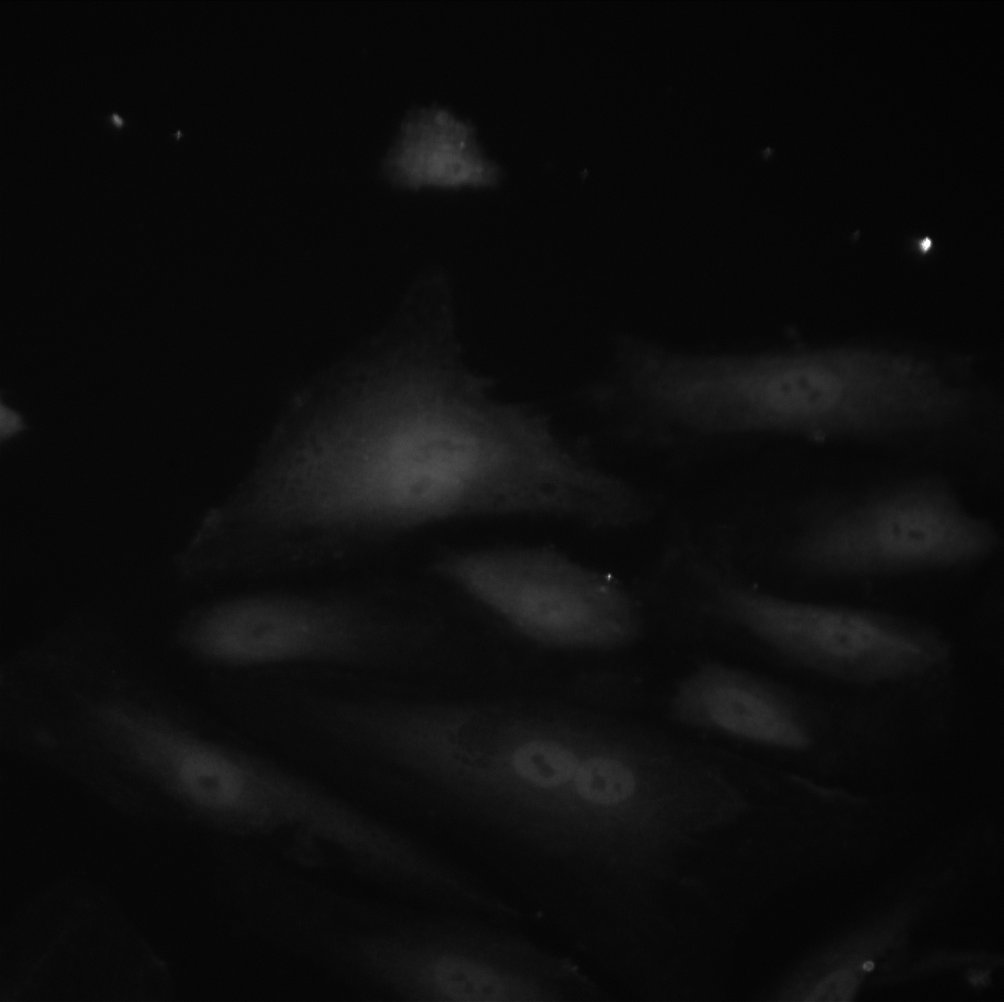
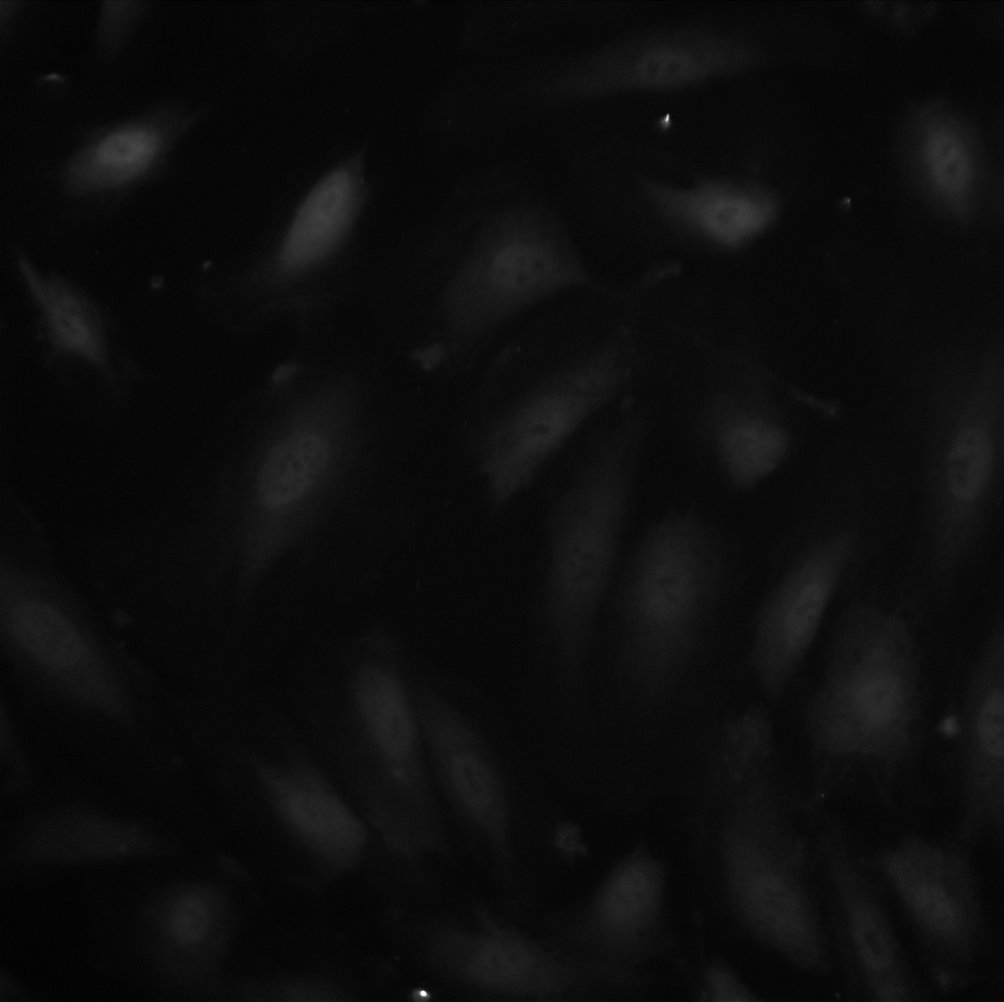
Below are some representative images of the samples. The 1 hour incubation time greatly improved the quality of the staining.
TCP:
63x
NP SiO2:
40x
0.5μm HP:
40x
0.5μm LP:
40x
3μm HP:
40x
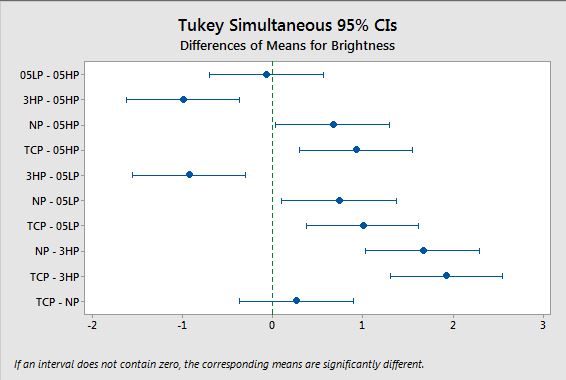
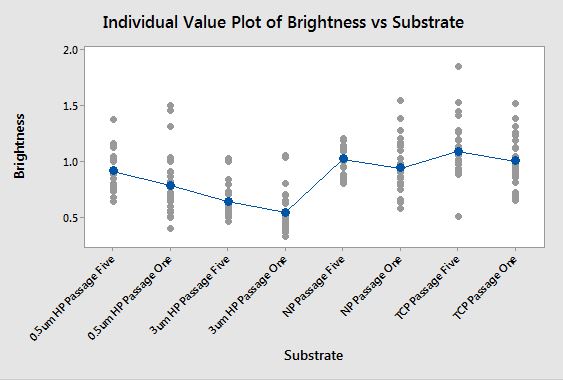
The sample sizes were >32 cells for each condition and a Tukey test was conducted and the results are shown below
Please let me know if anyone has trouble viewing the images, I will try to reattach them or upload them at a higher resolution.
Discussion/Future work:
Fortunately for us, the results don’t seem to have any different trends than our previous experiment so we don’t need to do all of our experiments with passage one cells. The actual ratios were different but I don’t think it’s fair to compare the actual numbers because the stain was with this most recent experiment for a longer period of time. It is interesting to note that the 0.5μm LP membranes don’t seem to be very different from the 0.5μm HP membranes as far as the localization of YAP goes. This could be due to the fact that the surface disruptions are the same size or porosity could come into play, but as of now, I’m not quite sure if it aligns with what we thought before. I would think that the more contiguous patches of SiO2 would make the cells think that it was stiffer than 0.5μm HP substrates. It is interesting to note the statistical differences between the membranes and nonporous substrates. Each group (nonporous/tcp, 3μm, and 05μm) is statistically different from one another. This is very promising in regards to supporting the “membranes are seen as soft substrates by cells” hypothesis and we intend to do the same experiment with passage one ADSCs. I also would like to look into our own mechanical dosing and look at timepoints from 4 hours to the three days that we tested to see how the localization of the YAP changes (or doesn’t). It would be interesting if the membranes impacted the initial localization and it would also be interesting to see if it took a while for cells to acclimate to their environments which would be shown as the substrates decreasing the amount of YAP in the nucleus on the membranes over time. We’re also hoping to look into RUNX2 (has to do with osteoblastic differentiation) and some other proteins that others who are looking at YAP/TAZ have also tested.
Edited: In response to Jim’s comments about comparing the two data sets, after talking to Henry I decided to normalize all of the data to its respective TCP control. From there, I compiled all of the data into a Tukey test to see if the two normalized data sets were different from each other. The results are shown below:

These results would indicate that the substrates between P1 and P5 do not show a statistically significant difference, showing HUVECs may not have as much of a mechanical memory as mesenchymal stem cells. The same substrates between the different days are highlighted.
Take homes: Between stiff, nonporous substrates, YAP localization isn’t different (it’s in a high concentration in the nucleus). Porous substrates result in lower nuclear YAP (3μm HP, 0.5μm HP, and 0.5μm LP) and 0.5μm LP and 0.5μm HP are not different. It’s also interesting to note that the 3μm HP membranes resulted in the least amount of nuclear YAP and the ratio was significantly lower than the 0.5μm LP and 0.5μm HP membranes.
Thanks for reading!
Spencer
 These results would indicate that the substrates between P1 and P5 do not show a statistically significant difference, showing HUVECs may not have as much of a mechanical memory as mesenchymal stem cells. The same substrates between the different days are highlighted.
I see the similarities in the trends from last time but I don’t see any direct comparisons between P1 and P5 cells. Can you do that and run your statistics to establish that they are not statistically different?
Jim,
I’m not sure we can directly compare the data sets due to differences in the staining time. The P1 trial was stained for one hour and the P5 was stained for 30 minutes (both at room temperature). The actual ratios for the P1 trial are almost double (all around). I did a quick run down of the factor that the results were all amplified by (assuming the stain time is responsible) and it’s 1.65x for the 0.5um HP, 1.59x for 3um HP, 1.93 for TCP, and 1.72x for NP SiO2. I’ll run some statistics tomorrow to see if through this amplification there is something we can do to test the two sets of data. I’m thinking if I multiply the P5 results by the average proportional change and then do a statistical analysis of those values, it might allow us to compare the two given the additional variable at hand. On the other hand, I’m not sure you would be able to draw any conclusions from that method not only because it assumes that the differences are due to the stain but also because we’re trying to modify the data to compare it with something different. I’ll give it a run though!
I wouldn’t try too hard. The reasons you give are valid. The best way to do the comparison is side-by-side with the same protocols – but seeing the same trends is rather suggestive too.
Jim, I normalized the two sets of data to the TCP control (of each respective trial) and compiled the data into a Tukey test. I feel like this is a good way to compare the two data sets. Also, this test shows no statistical difference between the same substrate across the two different time points.
Don’t forget to add in the Tukey post hoc p-value comparisons that we discussed. This should be showing up at the prompt above the figures in Minicab.
Can you make a small table of the most relevant comparisons?
Example:
NP vs. 3HP p<0.001 ?
NP vs. 0.5HP p<0.001 ?
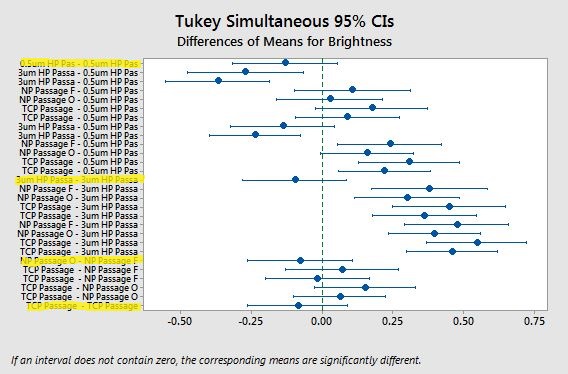
Your Tukey Confidence Intervals show that almost all comparisons have a p<0.05 (since the default is showing a 95% CI)
Looking at your Confidence Intervals, if we stick with p=0.05 for significance, we can say the following:
The two non-porous substrates (TCP and NP) are not different.
Porous substrates (0.5LP, 0.5HP, 3HP) are all significantly less than non-porous substrates.
0.5LP and 0.5HP are not different from each other.
3HP is the lowest and significantly less than 0.5LP and 0.5 HP.