Exosome Isolation Using Tangential Flow Update
Hey all!
In this post, I’d like to present some of my final data on the exosome isolation project and cover some data that was generated in response to questions asked during our previous discussion. To begin with, Tom asked whether or not it was possible to measure protein in the filtrate and retentate and see if there was a noticeable change in the concentrations. To do this, Henry and I ran 5 more experiments to be able to get the samples we needed, as well as to confirm some other results that we found. Three of the experiments used fresh plasma (which Henry had donated that morning and which was isolated according to the method given to us by Ryan Dawes) and two used the commercial plasma. In addition, due to the lack of prepared devices, we used two devices with 100 μm top channels and three devices with 300 μm top channels. The final variable that we added was running one sample (fresh plasma, 300 μm top channel) at a rate of 250 μL/min simply to determine if there was a speed effect. We used the NanoQuant to determine the protein concentrations in the liquid samples and these results are shown in Fig. 1.
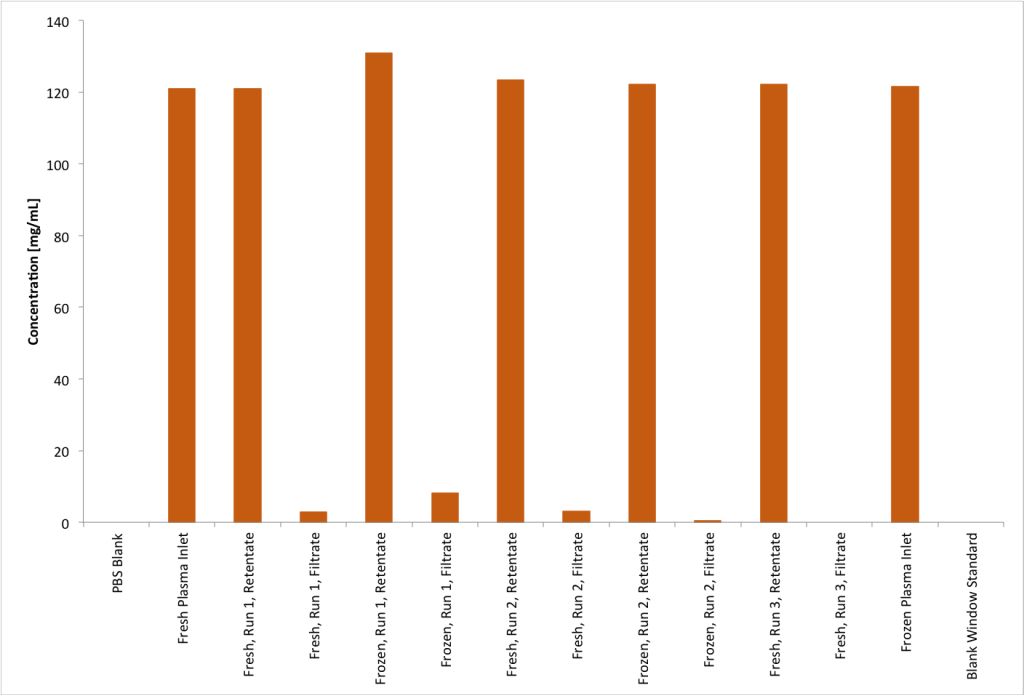
Figure 1: NanoQuant measurements of protein concentrations in filtrate and retentate.
In order to get concentration data, I made an approximation of plasma using BSA and read the absorbance values at concentrations of 100 mg/mL, 50 mg/mL, 25 mg/mL, 10 mg/mL, and 1 mg/mL. This gave me a standard curve and a resulting equation for concentration related to absorbance. This curve is given in Fig. 2 for future reference. It should be noted that I ran this in triplicate for statistical purposes. The data then shows us that there is some protein passing through the membrane and being collected on the filtrate side, but this is not a particularly large amount compared to the initial values. It should also be noted that the very fast run did not show any protein in the filtrate, which would make sense as the system is convection dominated and diffusion through the membrane would not have had time to occur. Therefore, we could hypothesize that increasing the residence time (i.e. decreasing flow rate even more) would increase the amount of protein that passes through the membrane. Decreasing the flow rate would still make the device competitive as we are already achieving times of 15 minutes per sample so doubling that time would not hurt the procedure.
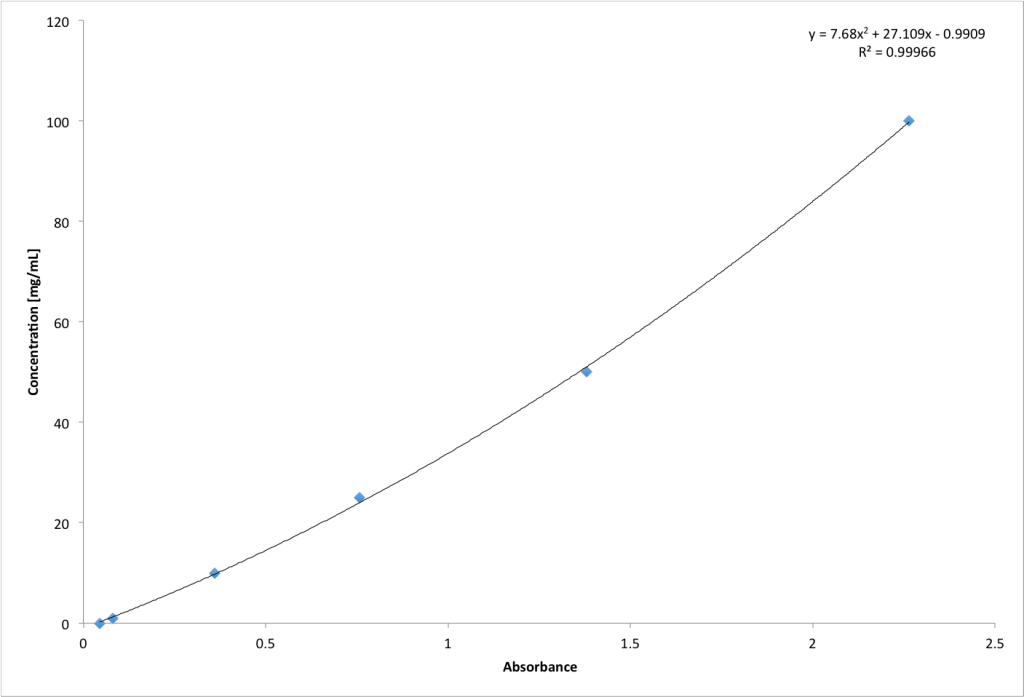
Figure 2: Curve fit for absorbance and BSA concentration.
The other thing that we did was to confirm the presence of exosomes in the plasma, as shown in the previous post. We also wanted to compare the fresh vs. frozen yields, as there was a difference observed in the previous results. When performing the experiments, we attempted to combat membrane breakage due to drying by placing the chips in a humidified petri dish immediately upon removal from the PDMS housing. This worked for pretty much all of the samples and going in to the coating step, 4 out of the 5 membranes were intact (we lost one due to breakage upon removal). However, as soon as I pulled the chips out to mount for SEM, they all broke. This was very disheartening for our results. There were fragments of membrane left that we imaged, however and one chip had half of a membrane left over the window. Therefore, we went in to the SEM not expecting much. Much to our surprise though, we saw some very interesting results. As you can see in Fig. 3, there does not appear to be much on the surface of the fresh plasma samples. There are some salt crystals, but there was not much else of note. This is kind of baffling and not a result that we expected to see. It could imply that there is something with the freezing process or some other treatment step that is bringing out more of the exosomes. It is either that or Henry simply doesn’t have any exosomes in his blood! There are some things that could be argued to be exosomes on the surface of these samples, but they are simply too few to make any conclusions.
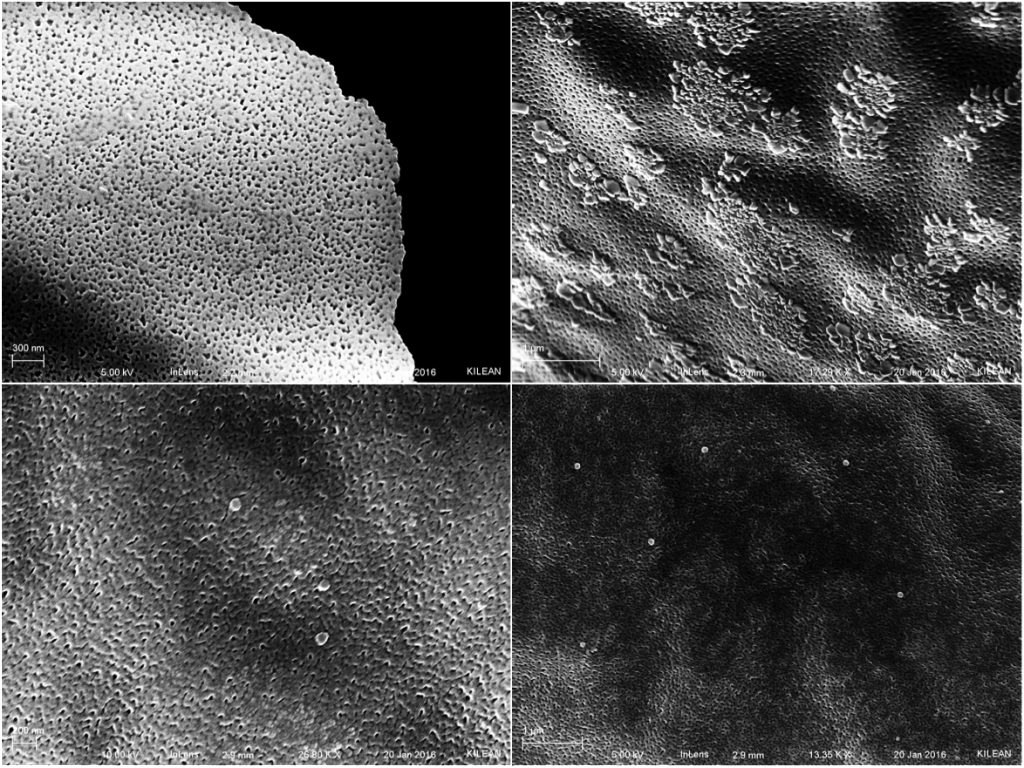
Figure 3: Fresh plasma samples showing very clean surfaces with some salt.
Once we got to the frozen samples however, there was a significant difference in surface morphology. On these samples, there was a noticeable amount of exosomes. The sample with half the membrane intact provided the best results and in Fig. 4 we can clearly see exosomes and salt crystals. This is further confirmed in Fig. 5 with EDX data. The exosomes in the SEM image appear white and have a halo around them, as most carbon samples would under an electron beam. There are also higher concentrations at the inlet side of the membrane, which we predicted previously.
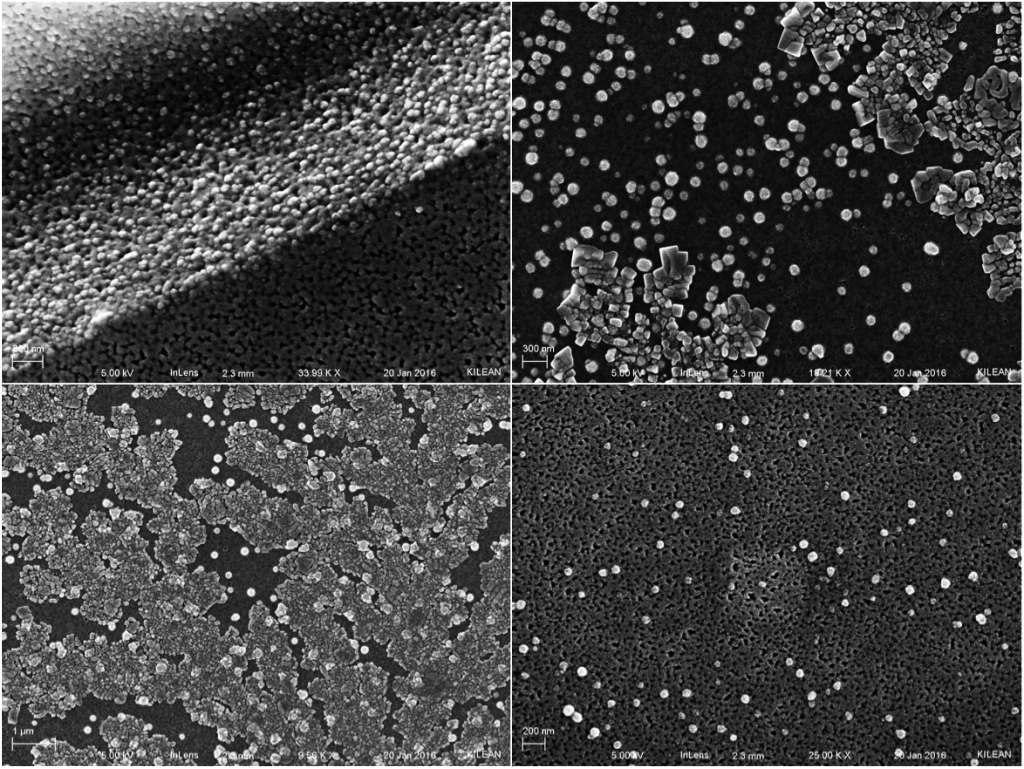
Figure 4: Frozen plasma samples showing large amounts of exosomes on the surface, contrasting with salt crystals on some surfaces.
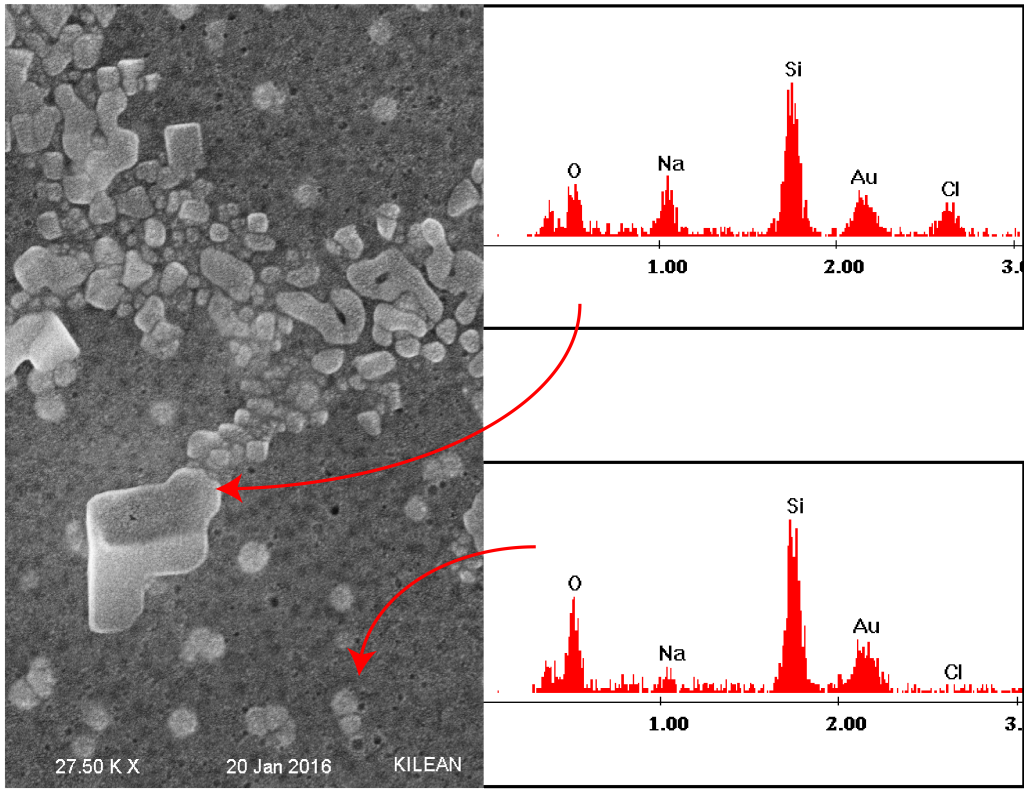
Figure 5: EDX spectra of a salt crystal and an exosome. There are significant differences in the spectra and the sodium signal in the exosome spectra can be attributed to background noise.
These results would appear to show that we can indeed capture what would seem to be exosomes on the membranes. Whether or not we can effectively remove them is probably a question for future studies. Additionally, it is quite curious how there seems to be no exosomes in the fresh blood samples. Why this occurs is definitely important and should be studied further. If it is consistent with all samples, then there is significance in the preparation of the plasma and should be considered in future applications.
This rotation experience has been great and I learned a lot of really cool stuff while I was also having fun! Thank you!
When you get a chance please upload all high quality originals to this post. The 4-panel merge is too low quality if I zoom into a section.