Using model for thick membrane separations
In this post I will describe the use of the 3-D computational diffusion model as applied to separations with thick membranes.
Experimental: Track etched membranes were trimmed to fit into round plastic sepcons and were sealed in the traditional way using an o-ring. 20uL of protein sample was pipetted inside the sepcon and 20uL of KCl was pipetted on the back of the membrane. Diffusion was allowed to occur for 24 hours. Retentate and dialysate were removed and run on a gel. Bands were quantified, and sieving coefficients were obtained by dividing the dialysate intensity by the retentate intensity.
Computational: The 3-D comsol simulation was remodeled to take into account the larger active area of track etched membranes and the 6um thickness. Free diffusion coefficients were calculated using Stokes-Einstein, and membrane diffusion coefficients were calculated using pore size/porosity data of track etched membranes.
Results:
The following figure shows the sieving coefficients of computational simulations and experiment separations.
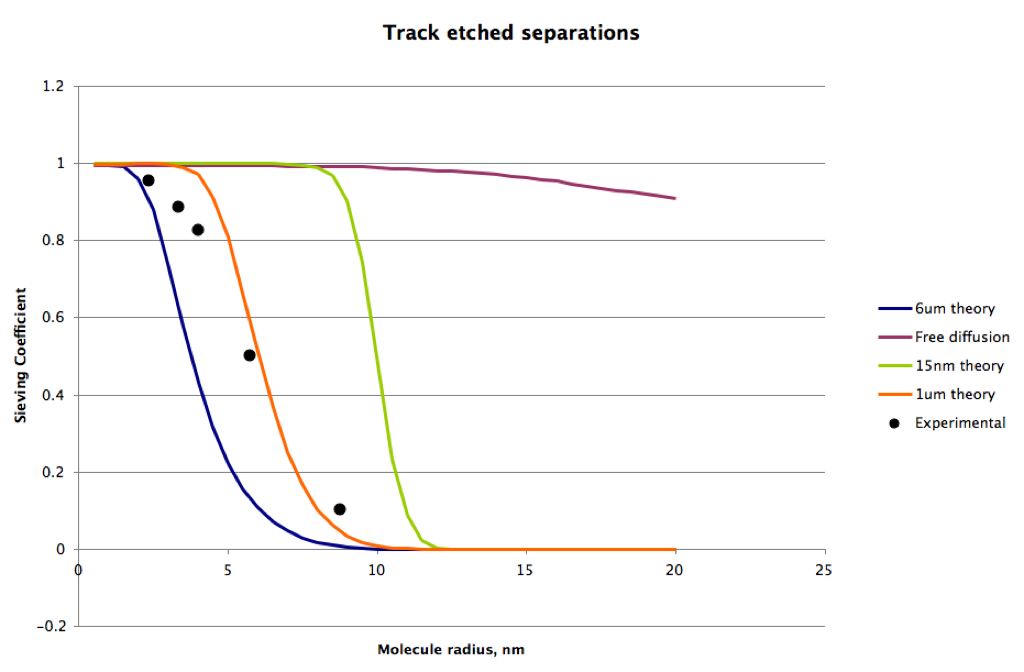
From this analysis, it seems that the diffusion through track etched membranes is quicker than expected (compare experimental to 6um line). Adjusting pore sizes and porosities by the error given by Sterlitech does not shift results much. Increasing the active area (the membrane sags a bit in the device) shifts the results slightly but not all the way to the experimental curve. Changing thickness of the membrane however has a much larger effect. Reducing the thickness to 1um compares more favorably to the experimental results. The reason for the discrepancy is unknown.
It is obvious however that the diffusion through thick membranes is much lower than the diffusion through 15nm membranes. In this analysis it is expected that thin membranes have a very sharp cutoff at the physical pore size and follow the expected free diffusion of the molecules better than the thick membranes.